Figure 1.
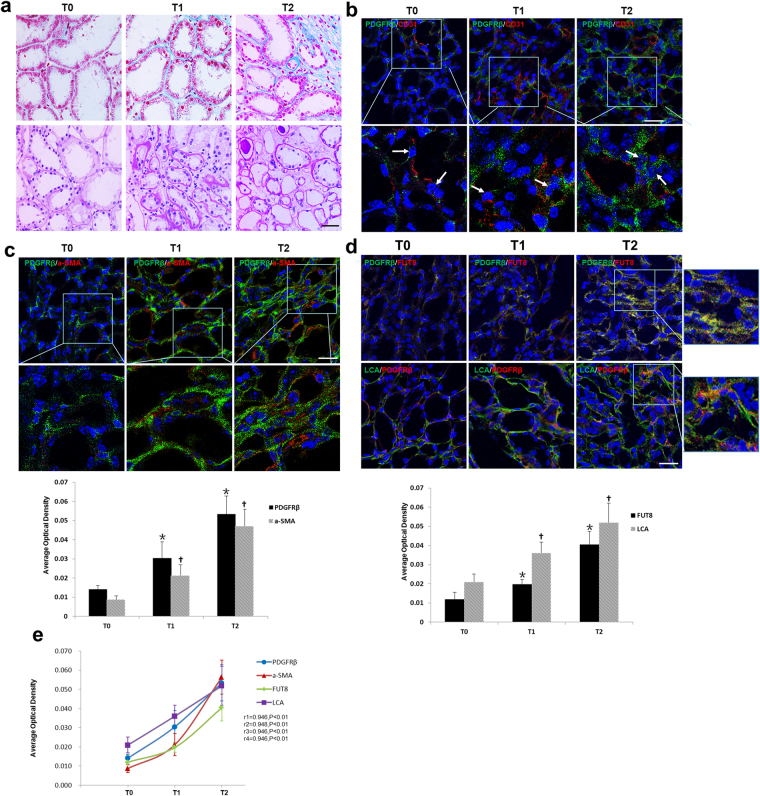
The pericyte-myofibroblast transition and core fucosylation were increased in patients with different Oxford classifications of IgAN. (a) Representative images of Masson’s trichrome-stained and PAS-stained sections from patients with different Oxford T classifications of IgAN. (b) Representative images of PDGFRβ (green) and CD31 (red) staining; white arrows indicate pericytes. Quantification is shown in the lower panel. (c) Representative images of PDGFRβ (green) and α-SMA (red) staining. Quantification is shown in the lower panel. (d) Representative images of dual staining for PDGFRβ (green) and FUT8 (red) and dual staining for LCA (green) and PDGFRβ (red). Quantification is shown in the lower panel. (e) Spearman’s correlation coefficients were used to examine the differences in the fluorescence intensity of immunostaining for PDGFRβ, α-SMA, FUT8, and LCA in patients with different Oxford T classifications of IgAN. r, Spearman’s correlation coefficient; r1, PDGFRβ; r2, α-SMA; r3, FUT8; r4, LCA. Scale bar, 50 μm. *P < 0.01, † P < 0.01. * and † indicate the comparison of the T1 or T2 group with the T0 group.

