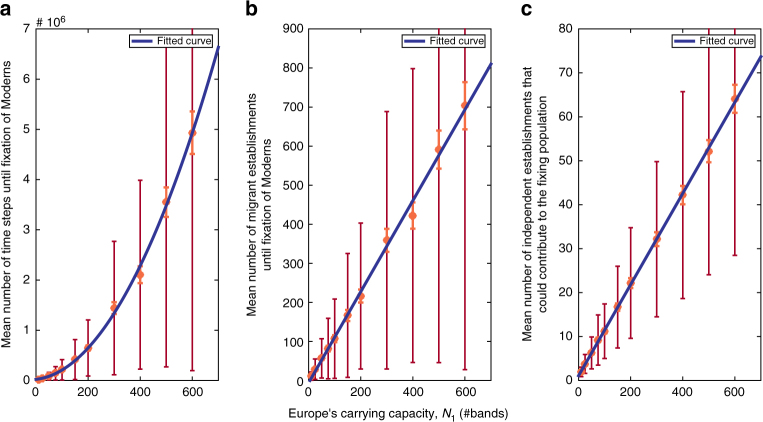
Fig. 1.
The time and number of successful migrations until species replacement. a Mean number of simulation time steps until complete replacement of Neanderthals by Moderns. Here and in (b) and (c), orange error bars denote two standard errors around the mean, and brown bars denote the standard deviation; 500 replicate simulation runs were conducted with each carrying capacity value. The dark blue line is a fit of the means to a quadratic function, demonstrating that the number of time steps to fixation scales with (N 1)2. b The mean number of migrant establishments in Europe that take place until replacement occurs is linearly related to N 1. Here and in (c) the dark blue line is a fit to a linear function. c The number of migrant establishments that occur while the Moderns are segregating in Europe on their way to fixation scales with N 1. For all panels, the probability of migration into Europe per time step, M 2 = 0.1 (N 2 = 100, m 2 = 0.001)

