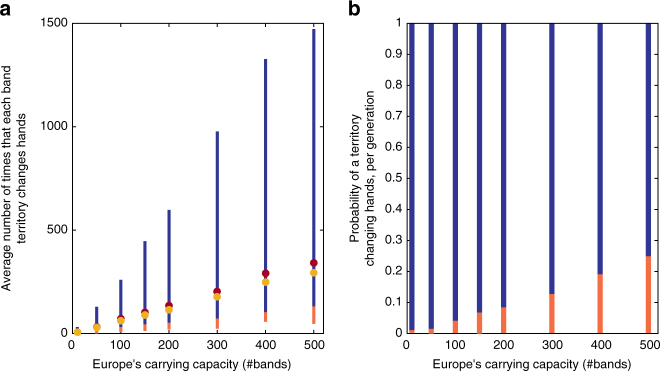
Fig. 2.
Comparing model predictions to the archaeological record. a Range of durations of species’ coexistence for various carrying capacities in Europe, N 1, in units of average number of events of band replacement per band territory. The range that covers 95% of the results is marked in dark blue, and the 5% of the simulations with the shortest coexistence durations is in orange (500 simulation replicates were conducted for each value of N 1). The mean and median values are marked in brown and dark yellow circles, respectively. Coexistence duration is defined as the period during which both species exist in the population at frequencies above 10%, between the last crossings of this threshold by each of the species, as shown by the orange and dark yellow circles in the time trajectories of Fig. 3. See Supplementary Note 1 for more details and discussion of alternative definitions. b Tests of the hypothesis of neutral replacement for a range of parameter combinations, assuming a species coexistence duration of 12,000 years: each point in the panel represents the result of a test at the p = 0.05 significance level. The range of parameters for which neutral replacement should be rejected is denoted in orange. The range for which the model should not be rejected is marked in dark blue

