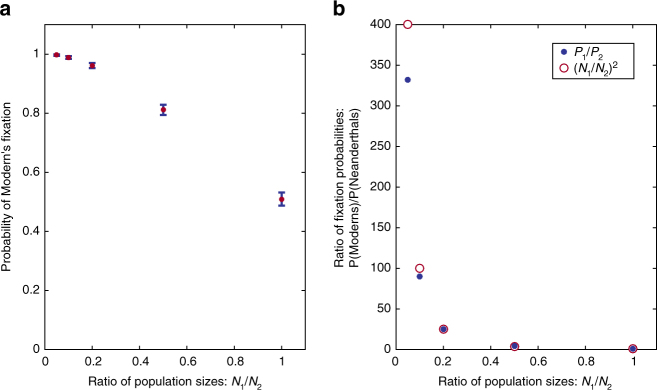
Fig. 4.
Fixation probabilities under bidirectional symmetric migration. a Probability of Modern’s fixation (brown; blue bars indicate two standard errors around the observed frequency of fixation). b Ratio between Moderns’ and Neanderthals’ probabilities of fixation, which is approximated by the square of the inverse of the ratio of population sizes (brown) for much of the range of this ratio. It is slightly lower for scenarios in which the Moderns’ population is much larger than the Neanderthals’. For all runs, m 1 = m 2 = 0.0001, N 2 = 500 (Africa), N 1 refers to Europe. 500 simulation replicates were conducted for each value of N 1/N 2

