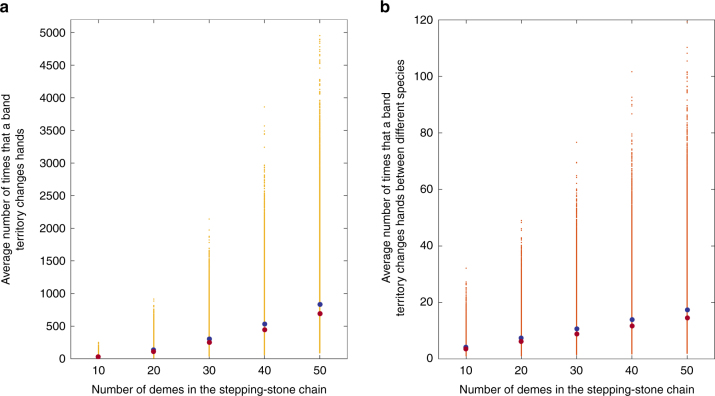
Fig. 6.
Band replacements in the spatially explicit model. The mean (dark blue) and median (brown) of the mean number of times that a band territory changes hands during the species replacement process. Panel a depicts these values for both band replacements that occur between bands of the same species and bands that are not of the same species. Panel b depicts these values for inter-species replacements only. 50,000 simulations were conducted for each value of the number of demes in the stepping-stone chain

