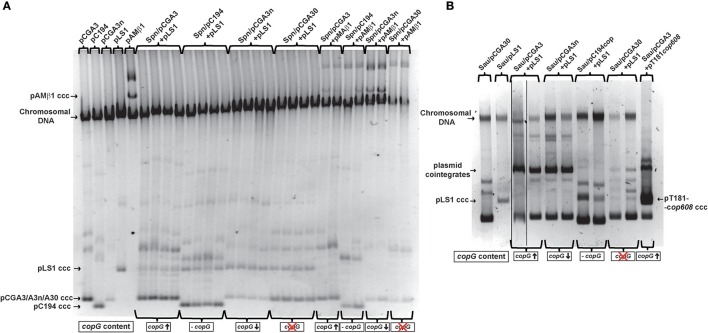
Figure 4.
Analysis of the plasmid DNA content of the indicated transformant clones grown under selective pressure for both the resident and the incoming plasmid. (A) Pneumococcal cells harboring pCAG3, pC194, pCGA3n, or pCGA30 were transformed with pLS1 and pAMβ1. The gel shows the total DNA content of several transformant clones. Four transformant clones were analyzed for each transformation with pLS1 and only two clones in the case of each transformation with pAMβ1. The combination of recipient strain and incoming plasmid is indicated on the top of the gel. The copG gene content of the resident plasmid in the recipient strain is indicated below the gel image. Homoplasmid strains harboring pCGA3, pC194, pCGA3n, pLS1, or pAMβ1 were used as controls. Supercoiled monomeric forms of the five plasmids are indicated in the gel; monomeric forms of pCGA3, pCGA3n, and pCGA30 have a similar electrophoretic mobility. (B) Staphylococcal cells harboring pCAG3, pCGA3n, pCGA30, or pC194 were transformed with pLS1 and pT181cop608. The gel shows the plasmid DNA content of several transformant clones. Two transformant clones were analyzed for each transformation experiment with pLS1, and one clone resulting from the transformation of S. aureus/pCGA3 with pT181cop608 was also analyzed. The combination of recipient strain and incoming plasmid is indicated on the top of the gel. As in (A), the copG content of the recipient strain in indicated below the gel image. Homoplasmid strains harboring pCGA3 or pLS1 were used as controls. Supercoiled monomeric forms of pLS1 and pT181cop608 are indicated in the gel.

