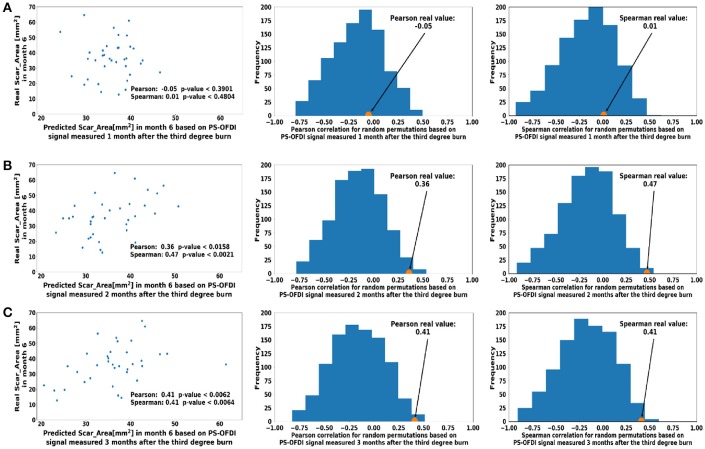
Figure 3.
Predicted scar area at month 6 based on measurements taken at a single time point (A). Month 1 (B). Month 2 (C). Month 3 after third-degree burn injury. The control histograms of the correlation coefficients corresponding to randomly shuffled measurements appear on the right-hand side of each panel.

