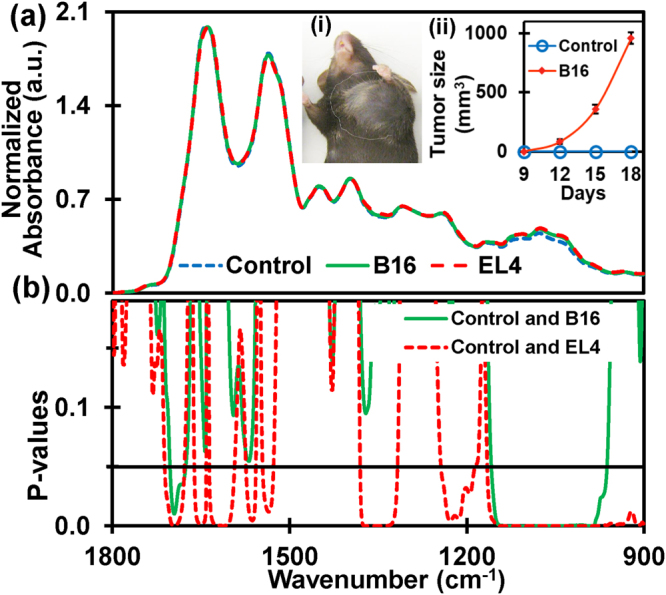
Figure 1.

The discriminatory region of infrared absorbance spectra. (a) Average normalized ATR-FTIR spectra of serum samples extracted from EL4-lymphoma (n = 8), B16-melanoma (n = 8) mouse models in wild types and corresponding control types (n = 15). The inset (i) shows B16-melanoma mouse with tumor size approximately 1000 mm3 (day 18). Increase in volume of the tumor from the day 9 to day 18 of tumor inoculation in B16-melanoma mouse is as in inset (ii). Similar to the B16 mouse, elevation of tumor size is also monitored in EL4-lymphoma. The serum sample is extracted for both types of mice when tumor size becomes bigger than 1000 mm3. (b) Student’s t-test (two-tailed unequal variance) p-values of absorbance. Discriminatory region for lymphoma with higher significance (p < 0.05) are amide I of protein, amide II of protein, C-H bends of CH3/CH2 groups in α- and β- anomers, asymmetric phosphate I, and carbohydrates with predominant contributions nucleic acids (DNA/RNA via PO2 − stretches). Discriminatory regions of melanoma are amide I and carbohydrates with predominant contributions of nucleic acids.
