Figure 1.
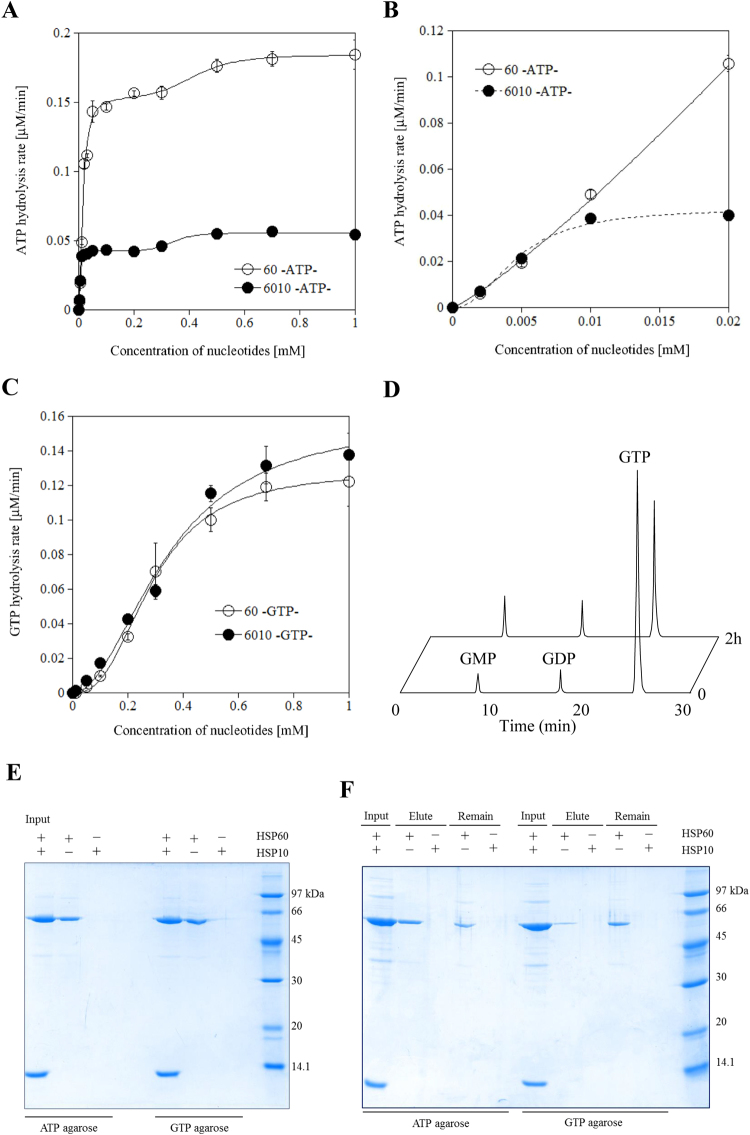
GTPase activity of HSP60 and physiological functions. (A), ATPase activity of HSP60 in the presence or absence of HSP10. The kinetic parameters were calculated by curve fitting to the Hill equation 1 or 2 in the Materials and Methods section by Kaleida Graph. (B), ATPase activity of HSP60 in the absence or presence of HSP10 in the low concentration range from 0 to 0.02 mM. The kinetic curves were directly fitted to the Hill equation 2. (C), GTPase activity of HSP60 in the presence or absence of HSP10 was calculated by curve fitting to the Hill equation 2. (D), Purified HSP60 was incubated with GTP at 37 °C for 2 h. Sample of time 0 and 2 h were separated by a C18-reverse phase column and absorbance at 256 nm was recorded. (E), NTP-pull down assay was performed using ATP- or GTP-agarose in the presence of HSP60 or HSP10. In the current study, to stabilize the interaction between HSP60 and NTP-agarose, a pull down assay was performed in the presence of 0.2 mM AlCl3 and 10 mM NaF. Samples were separated by 12% SDS-PAGE and detected by Coomassie Brilliant Blue R250-staining. (F), ATP- or GTP-agarose was eluted with 1 mM ATP or GTP in the presence of 0.2 mM AlCl3 and 10 mM NaF, respectively.

