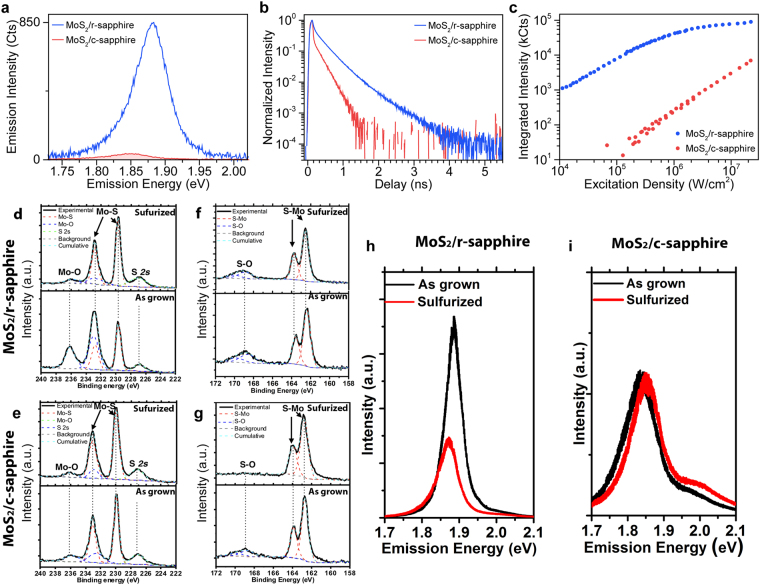
Figure 2.
Photoluminescence enhancement and non-radiative rate suppression by oxygen bonding in monolayer MoS2 grown on r-sapphire. (a) Comparison of the PL spectra of monolayer MoS2 grown on c-sapphire (MoS2/c-sapphire; red curve) to that of monolayer MoS2 grown on r-sapphire (MoS2/r-sapphire; blue curve) reveals that the PL of MoS2/r-sapphire is substantially brighter and shifted to higher energies. (b) Likewise, the excited state lifetime of MoS2/r-sapphire (red curve) is clearly enhanced compared that of MoS2/c-sapphire. (c) As a direct result of the longer excited state lifetimes, the scaling of the emission intensity of the PL with excitation density of MoS2/r-sapphire (blue curve) shows an earlier onset of exciton-exciton annihilation (i.e., sublinear behavior) than that of MoS2/c-sapphire which is linear over the same range of excitation densities and ~100× dimmer. (d–e) The XPS spectra in the Mo range of MoS2 on r-sapphire (d) and c-sapphire (e). The Mo-O bonding is also clearly identified in Mo 3d range when the growth is on r-sapphire (d) but negligible on c-sapphire. (e) The reduced oxygen concentration agrees well with the quenched PL intensity in Fig. 3h, indicating the oxygen doping is the key factor of the PL enhancement on r-sapphire. (f–g) XPS spectra in the S range of MoS2 on r-sapphire (f) and c-sapphire (g). In addition to the expected S 2p peak, S-O bonding is observed in both as-grown samples. After the sulfurization, the S-O bonding can be reduced on c-sapphire, indicating the S-O in this case is due to the unsulfurized MoOx. (h) PL spectra of MoS2/r-sapphire before and after sulfurization. The PL quenches ~51% after the sulfurization. (i) PL spectra of MoS2/c-sapphire before and after sulfurization. The PL is ~10 meV blue shifted after the sulfurization, which may be due to the reduction of S vacancies after the sulfurization.

