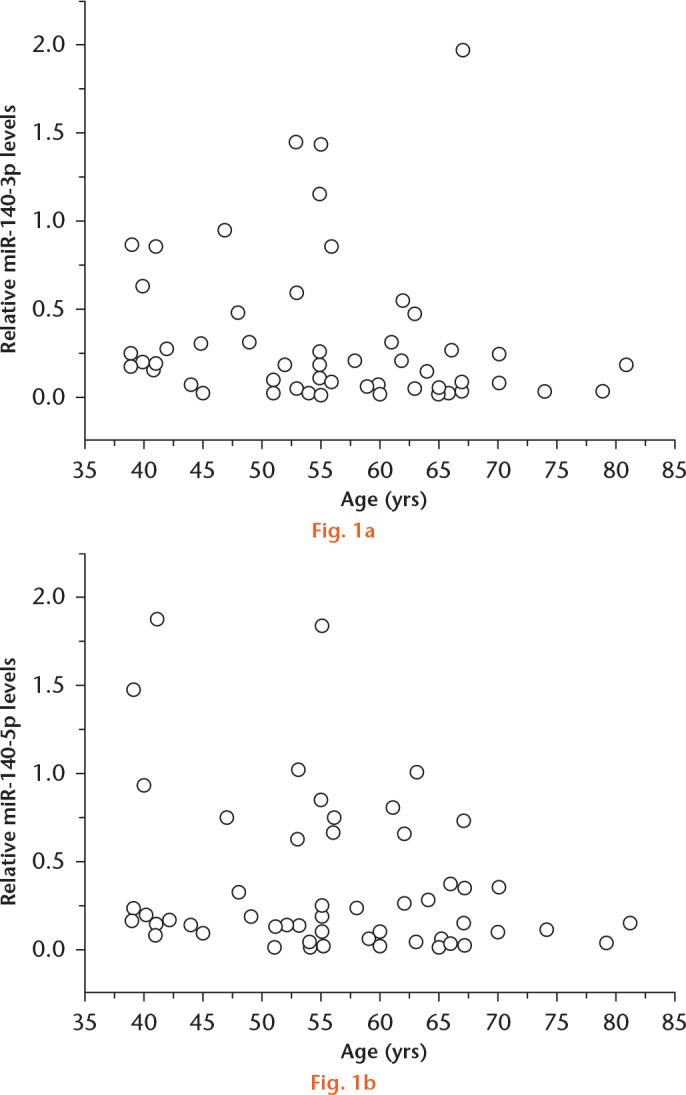
Scatter diagrams showing the correlation between the expression of a) miR-140-3p, b) miR-140-5p, and age. They were drawn for the relative expression of miR-140-3p/miR-140-5p and age in the normal controls, mild, moderate and severe osteoarthritis. As shown in the scatter diagram, there was no significant linear correlation between age and the expression of miR-140-3p/miR-140-5p in synovial fluid.
