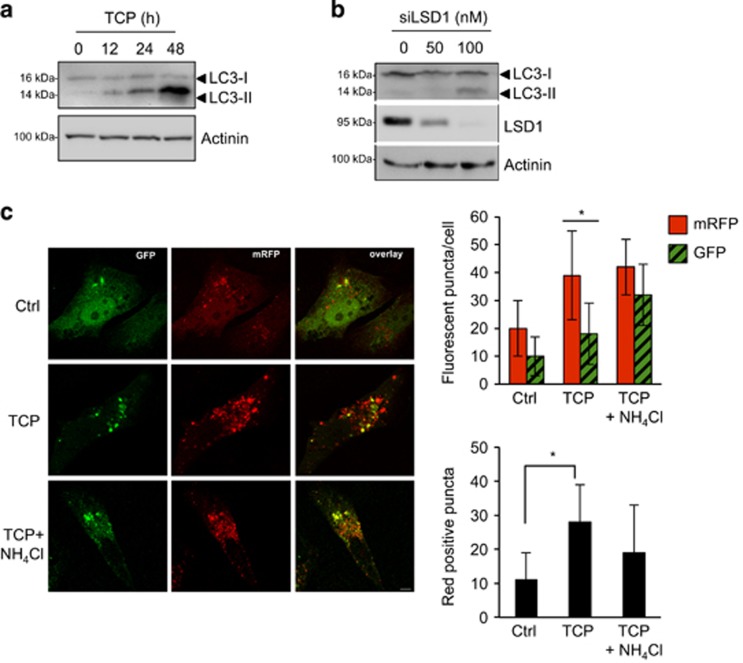
Figure 3.
LSD1 inhibition induces autophagy. Tet-21/N cells were treated with TCP for the indicated times (a), or siLSD1 at different concentrations as indicated (b), and protein extract was prepared and probed using anti-LC3 antibody. LSD1 protein level in cells transfected with siLSD1 or control (0) was shown. Actinin was probed as loading control. (c) Tet-21/N was transiently transfected with GFP-mRFP-LC3 tandem construct and treated with TCP alone or in combination with 20 mM NH4Cl for 24 h. After treatment, cells were fixed and analyzed by confocal microscopy. Bar, 10µm. Histograms show the number of GFP or mRFP puncta (upper graph) or the number of only-red positive (GFP-negative) puncta (lower graph). The values are expressed as means±s.d. (n>100 cells). *P<0.00001.

