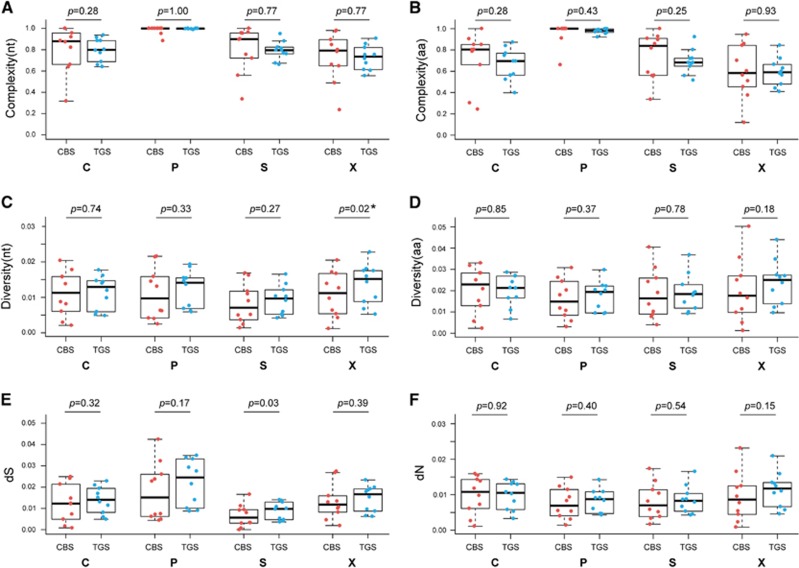
Figure 2.
QS complexity at nucleotide level (A) and amino-acid level (B); genetic distance at nucleotide level (C) and amino-acid level (D); dS (E) and dN (F) of C, P, S and X ORFs based on CBS and TGS data. Line above the box indicated the maximum, upper line of the box indicated the 75th percentile, line in the box indicated the median value, lower line of the box indicated the 25th percentile and line below the box indicated the minimum. Points in red represent the characteristics of QS derived from CBS, and points in blue represent the characteristics of QS derived from TGS. clone-based sequencing, CBS; open reading frame, ORF; quasispecies, QS; third-generation sequencing, TGS.

