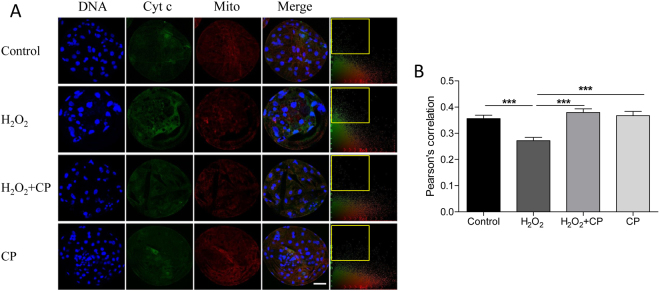
Figure 6.
Colocalization of cytochrome c and mitochondria in blastocysts in different groups. (A) Blastocysts were labeled with a cytochrome c specific antibody (green) and Mito Tracker Red. (B) Colocalization was analyzed using Image-Pro Plus; frame indicates released cytochrome c. Pearson’s correlation was analyzed using Image-Pro Plus. Data are expressed as the mean ± SEM. In addition, ***p < 0.001 indicates significant differences between different groups. Bar = 40 µm. The experiments were replicated three times with 246 blastocysts.

