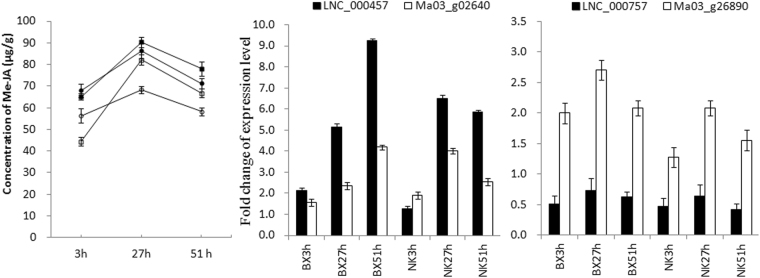
Figure 7.
Concentration of JA and the expression levels of potential lncRNAs and coding RNAs related to JA biosynthesis during banana by F. oxysporum infection. (A) Concentration of SA is from HPLC-MS. Error bars represent SE from 6 samples. fwt, fresh weight. Infected ‘BX’ (filled square) and mock-inoculated ‘BX’ (open square). Infected ‘NK’ (filled circle) and mock-inoculated ‘NK’ (open circle). (B) Validation of lncRNA and its co-located, potential target gene through qRT-PCR. AOS, allene oxide synthase. OPR, 12-oxophytodienoate reductase. The Y axes are the relative expression abundance from three biological replicates. Bars indicate ± standard error.

