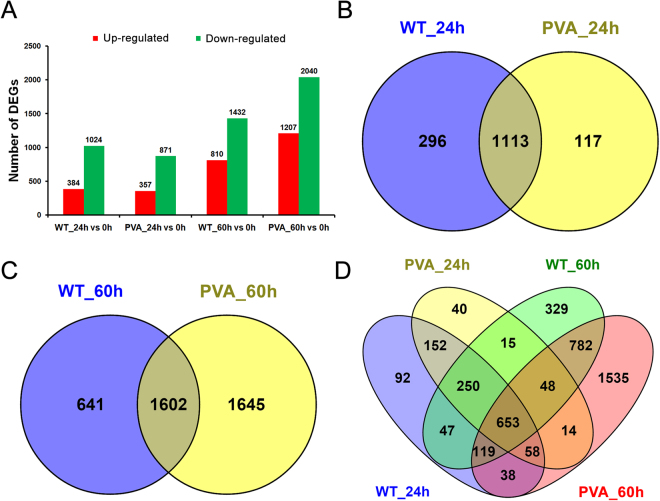
Figure 2.
Comparative analysis of differentially expressed genes (DEGs) at 24 and 60 hpi. (A) Numbers of DEGs compared between two samples (WT_24 h vs 0 h, PVA_24 h vs 0 h, WT_60 h vs 0 h, and PVA_60 h vs 0 h). (B) Venn diagram showing the overlap of DEGs between WT_24 h and PVA_24hpi. (C) Venn diagram showing the overlap of DEGs between WT_60 h and PVA_60 hpi. (D) Venn diagram showing the overlap of DEGs among the four samples compared with no inoculation (0 h).

