
FIG 2.
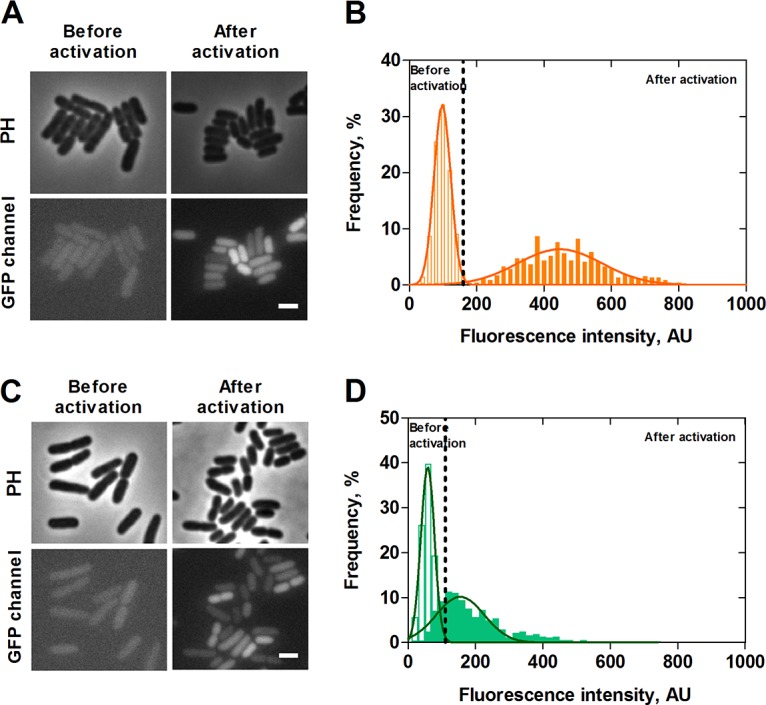
Single-cell analysis of PyhjX and PyjiY activation during growth in LB medium. E. coli cells expressing gfp under the control of the yhjX or yjiY promoter, respectively, were grown in LB medium, and fluorescence micrographs were taken before (exponential growth phase) and after activation (post-exponential growth phase) of the two TCSs. Representative fluorescence and phase-contrast images of PyhjX-gfp and PyjiY-gfp reporter strains are shown in panels A and C, respectively. The corresponding distributions of the fluorescence intensity of the PyhjX-gfp and PyjiY-gfp reporter strains are depicted in panels B and D. Unfilled bars refer to values prior to activation, and filled bars refer to values observed after activation. Dashed lines represent the threshold of activation for each of the reporter strains. A total of 200 cells were analyzed in each experiment, and frequency refers to the percentage of cells with the indicated intensity (see Materials and Methods for details). The continuous curves represent Gaussian fits based on the histograms of the fluorescence intensity. PH, phase contrast; AU, arbitrary units. Scale bar, 2 μm. Experiments were performed independently three times.