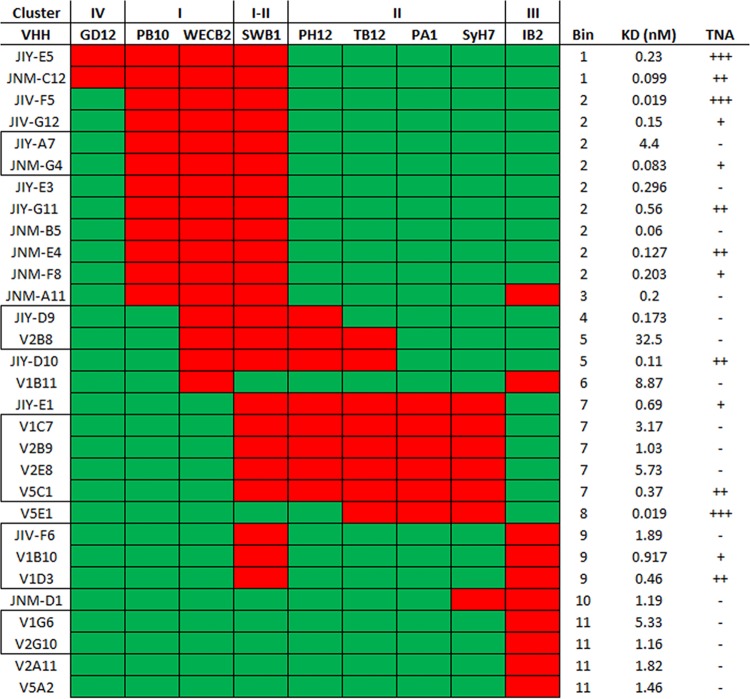
FIG 5.
Relative locations of the epitopes recognized by 30 different RTA-specific VHHs. Thirty RTA-specific VHHs (left column) were subjected to cross-competition sandwich ELISA with a panel of nine murine MAbs (top row) representing the four different epitope clusters on RTA. Shown here is a binary representation of the actual sandwich ELISA (Fig. S6) in which individual cells are colored red for >50% competition (VHH versus MAb) and green for <50% competition. VHH clonal families are boxed (left column). VHHs with the same competition profile were grouped into bins (right column). For reference, VHH binding affinities and TNA (from Table 2) are shown in the far right columns.

