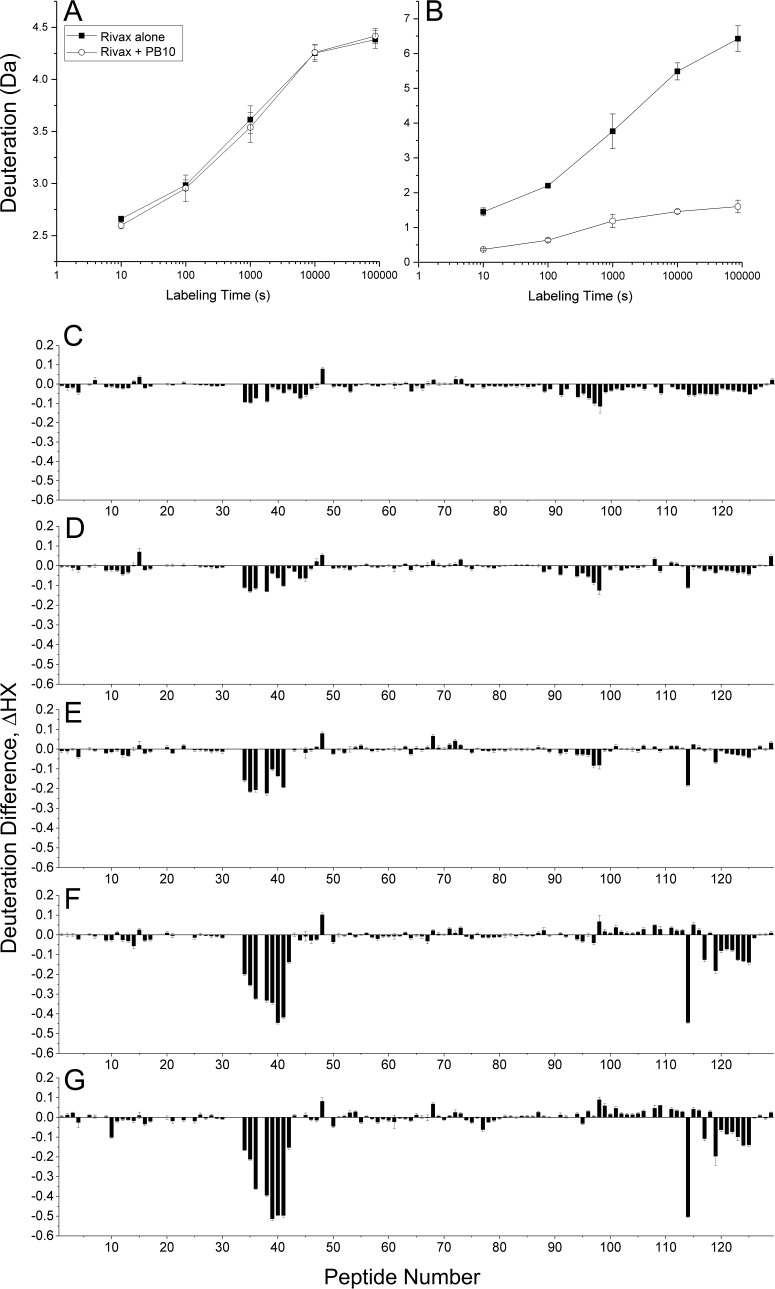
FIG 2.
HX-MS analysis of RiVax in the presence of PB10. RiVax was subjected to HX-MS analysis in the absence or presence of MAb PB10. (A and B) HX kinetics of two representative RiVax peptides. Panel A shows peptide 1 (residues 0 to 11), where the rate of HX was unaffected by PB10. Panel B shows peptide 38 (residues 93 to 107), where the rate of HX was substantially slowed by PB10. The filled squares denote RiVax alone. The open symbols denote RiVax bound to PB10. (C to G) The uptake at each HX time for RiVax labeled alone was subtracted from the uptake in the presence of PB10, resulting in mass differences that are plotted at (C) 13 s, (D) 100 s, (E) 1,000 s, (F) 10,000 s, and (G) 86,000 s (24 h) of labeling. Error bars represent the standard deviations of triplicate measurements propagated through the mass differences.

