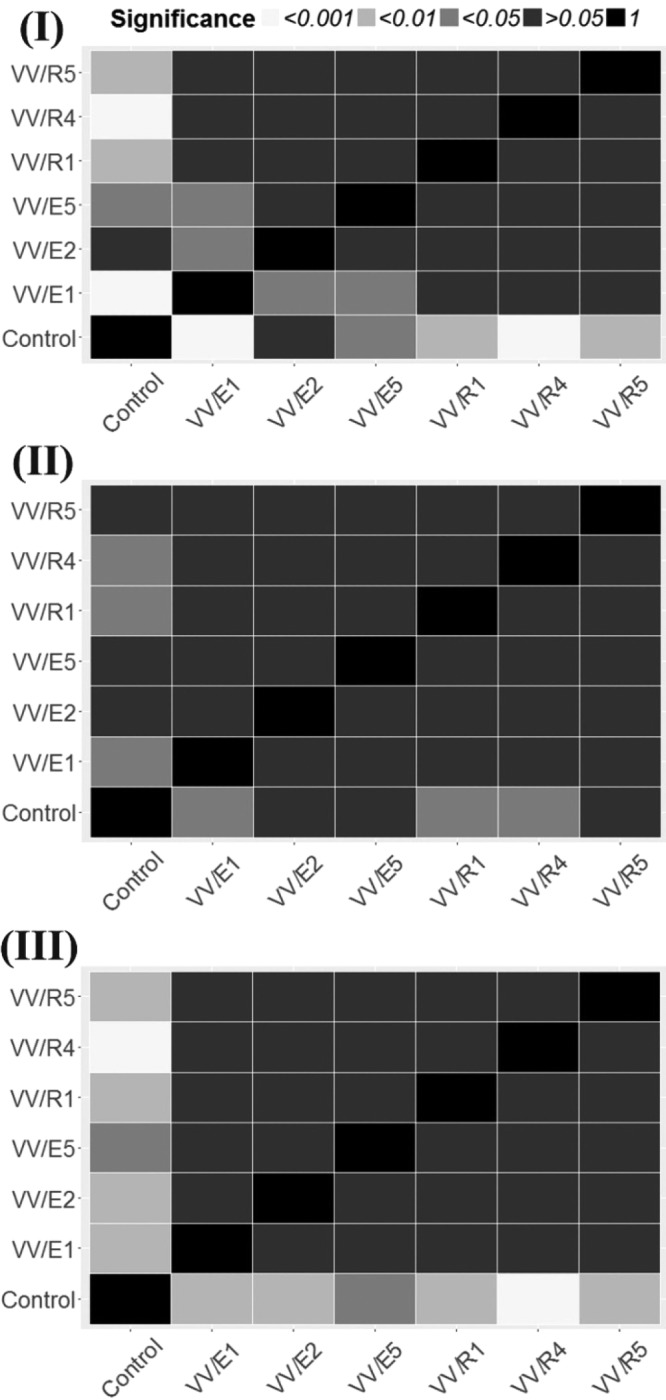
FIG 4.

Analysis of significant differences between the number of fungal pathogens isolated from plants treated with the different actinobacteria versus the number of pathogens isolated from control plants. The analysis is shown as heatmaps of independence assumptions between the type of actinobacterial treatment and the number of fungal pathogens isolated. Color key corresponds to the significance of chi-square or Fisher's test results (according to expected cell values). (I) Data relative to Dactylonectria sp.-Ilyonectria sp. group; (II) data relative of P. minimum; (III) data relative to P. chlamydospora. Data shown correspond to 3 batches of 25 surviving plants in 3 experimental nurseries (2013, 2014, and 2015 growing seasons).
