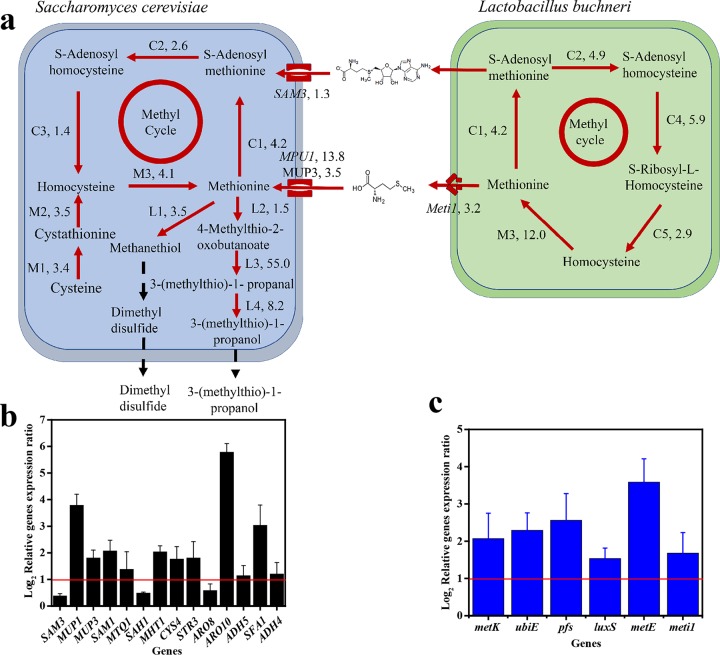
FIG 6.
Model of S. cerevisiae-L. buchneri interactions based on RT-qPCR and 3-(methylthio)-1-propanol and dimethyl disulfide analyses. (a) Model of S. cerevisiae-L. buchneri interactions. The red solid lines represent upregulated reactions in coculture relative to monoculture. The black dashed lines represent the generation of 3-(methylthio)-1-propanol and dimethyl disulfide. M1 to M3 represent the pathway from cysteine to methionine, C1 to C5 represent the methyl cycle pathway, and L1 to L4 represent methionine catabolism. (b and c) Relative gene expression ratios in S. cerevisiae (b) and in L. buchneri (c). The red lines indicate >2-fold difference. Data are shown as the mean ± SD (n = 3).

