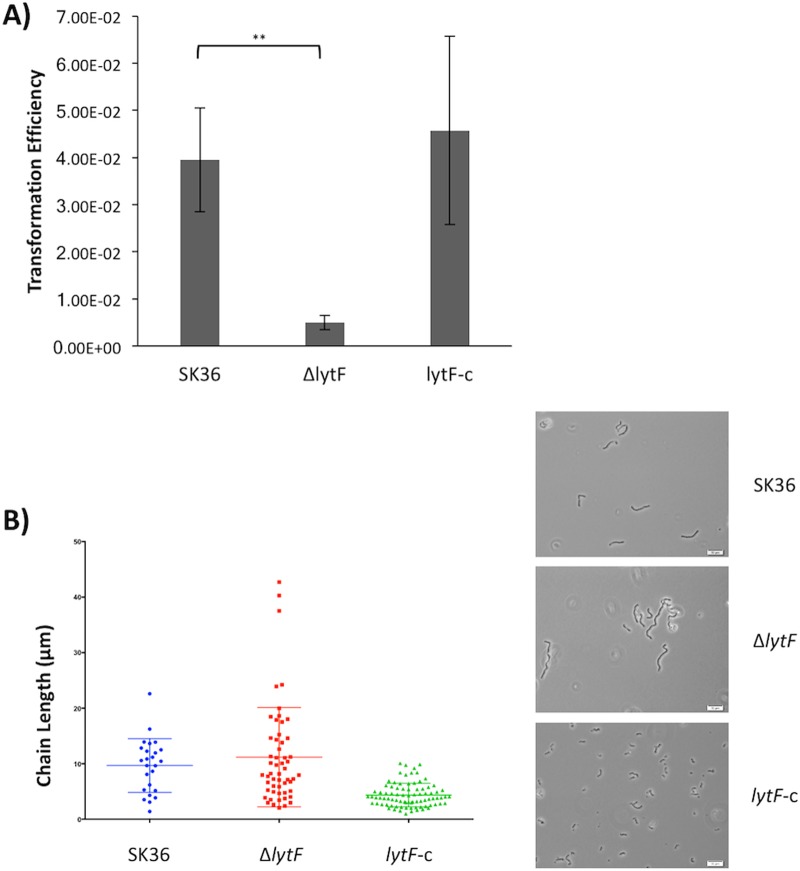
FIG 5.
LytF effects on transformation and cell division. (A) Cells were grown to an OD600 of ∼0.08 in TH medium with 2.5% heat-inactivated horse serum. Chromosomal DNA (kanamycin resistance) (37.6 ng/μl) and 0.5 μg/ml CSP were added, and cells were further incubated for 2 h. Cells were plated on selective and nonselective TH plates. Transformation efficiency was calculated as the number of kanamycin-resistant CFU relative to the CFU on nonselective agar. The decrease in ΔlytF transformation efficiency was statistically significant, compared to the wild-type value (**, P = 0.0099). Data represent the means and standard deviations of three independent experiments. (B) Cells were grown to mid-log phase, and images were obtained with oil immersion using an Olympus BX51 microscope, an Olympus DP72 digital camera, and cellSens 1.3 software. Images were adjusted for brightness and contrast and are representative of three independent experiments with similar outcomes. Chains from three images per strain were measured using ImageJ. Chain length differences between the strains were not statistically significant. Scale bars, 10 μm.

