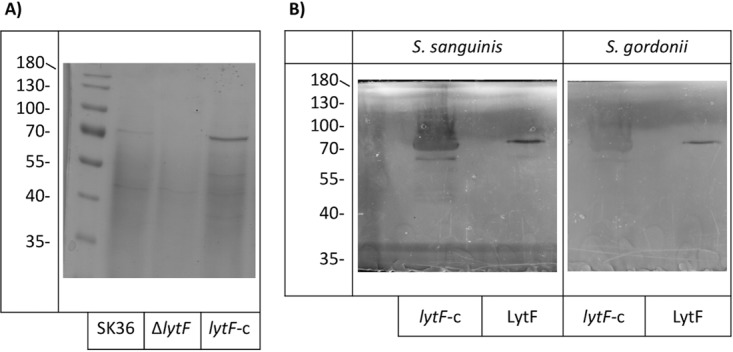
FIG 9.

Precipitation and purification of LytF from S. sanguinis. (A) SDS-PAGE analysis of proteins precipitated from culture supernatants with 60% ammonium sulfate saturation. The image is representative of at least three experiments performed on different days. (B) Zymogram assays with S. sanguinis substrate cells (left) or S. gordonii substrate cells (right). Both lytF-c protein samples (left lanes) and purified LytF (right lanes) showed hydrolysis of both species. Zymograms are representative of three separate experiments performed on different days. Images were processed to increase the visibility of the bands.
