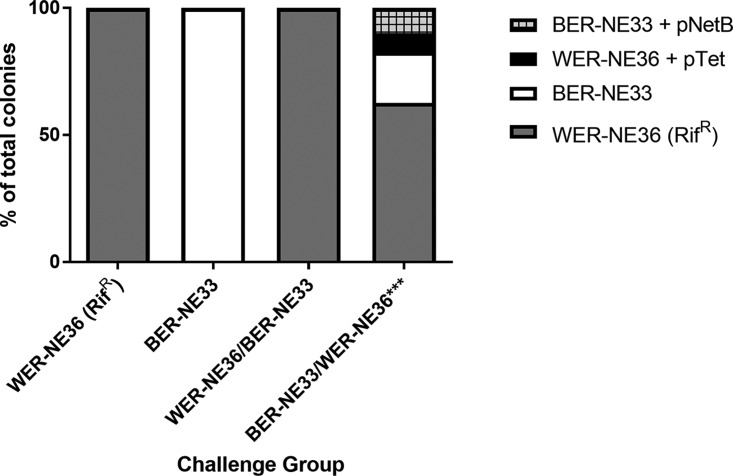
FIG 5.
The distribution of isolated colonies from the in vivo cochallenge model. The antibiotic resistance profile indicates the nature of the colonies as the % of total colonies isolated. In the group challenged with BER-NE33 in the morning and WER-NE36 in the afternoon, 63% of the colonies were the rifampin-marked WER-NE36 donor, 20% of the colonies were BER-NE33, 10% of the colonies isolated were shown to be BER-NE33 transconjugants, and 7% were shown to be WER-NE36 transconjugants.

