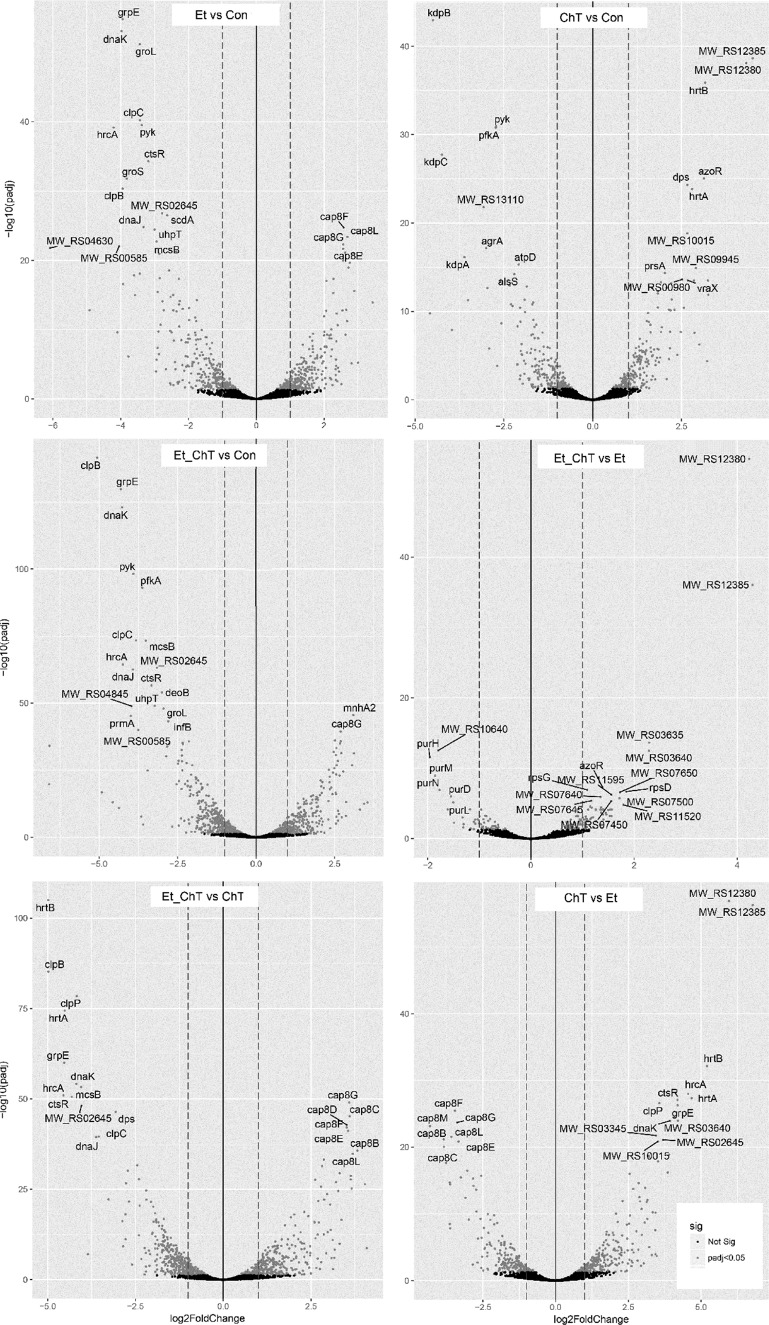
FIG 3.
Volcano plots of differential gene expression for S. aureus biofilm formed in response to treatment with sublethal concentrations of disinfectants. DESeq2 gene expression analysis was performed, and the top 20 differentially expressed genes (adjusted P value < 0.05 and logFC ≥1, sorted by adjusted P value) between individual treatments are indicated. The dashed line shows the logFC 1 threshold for downregulated (left line) and upregulated (right line) genes. Highlighted points are differentially expressed genes (P value < 0.05). Con, untreated biofilm; Et, ethanol treatment; ChT, chloramine T treatment; Et_ChT, combination of both disinfectants.

