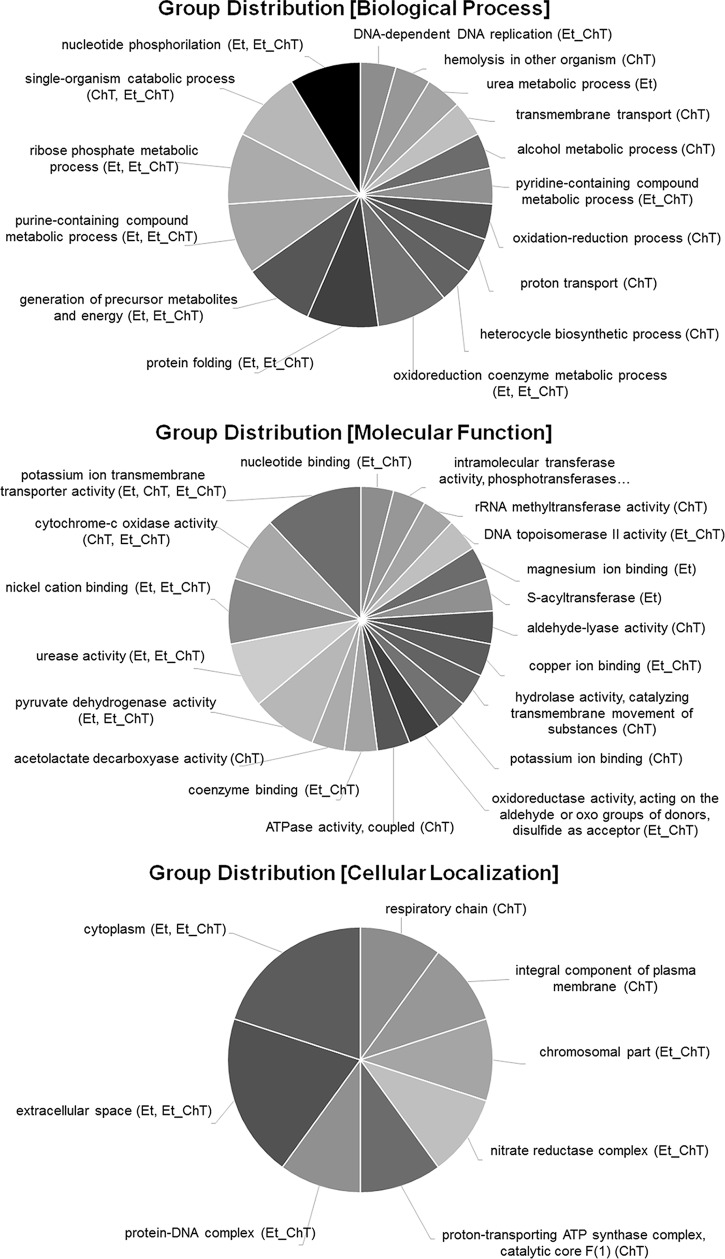
FIG 6.
Multilevel visualization of group distribution for GO terms in response to all treatments. Group classification from differential expression analysis of genes identified as downregulated (adjusted P value < 0.05 and logFC ≥1) in biofilm formed in response to treatment with sublethal concentrations of the studied disinfectants versus untreated biofilm is shown. Data were analyzed and visualized in Blast2go.

