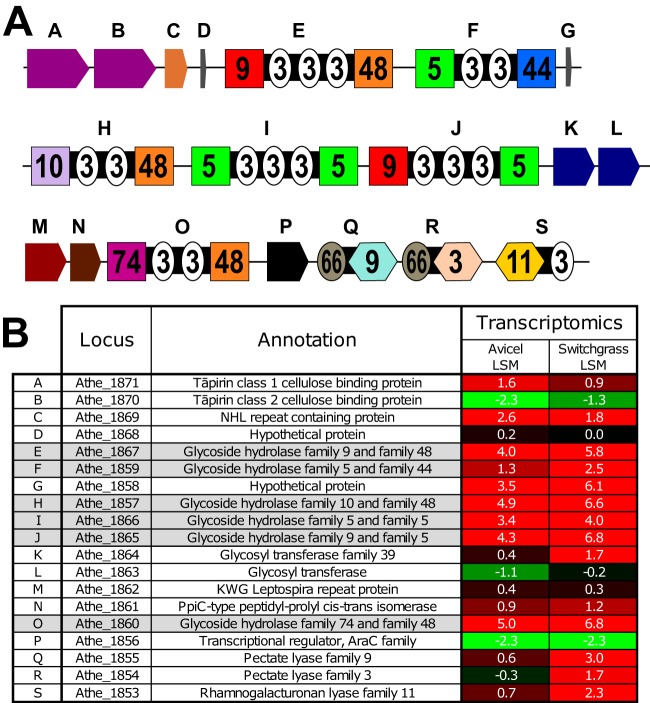
FIG 1.
GDL of C. bescii. (A) Genes (lettered A to S) comprising the GDL. GH domains are shown as boxes containing the GH family number. CBM domains are shown as circles containing the CBM family number. PL domains are shown as hexagons containing the PL family number. (B) Locus tag, annotation, and transcriptomic data for genes A to S. Transcriptomic values are shown as log squared means (LSM) for transcript levels for C. bescii grown on Avicel (microcrystalline cellulose) or switchgrass. An LSM value of 0 represents the average transcription level, positive values (highlighted in red) represent higher-than-average transcription, and negative values (highlighted in green) represent lower-than-average transcription. The rows for the six GDL GHs are shaded gray.

