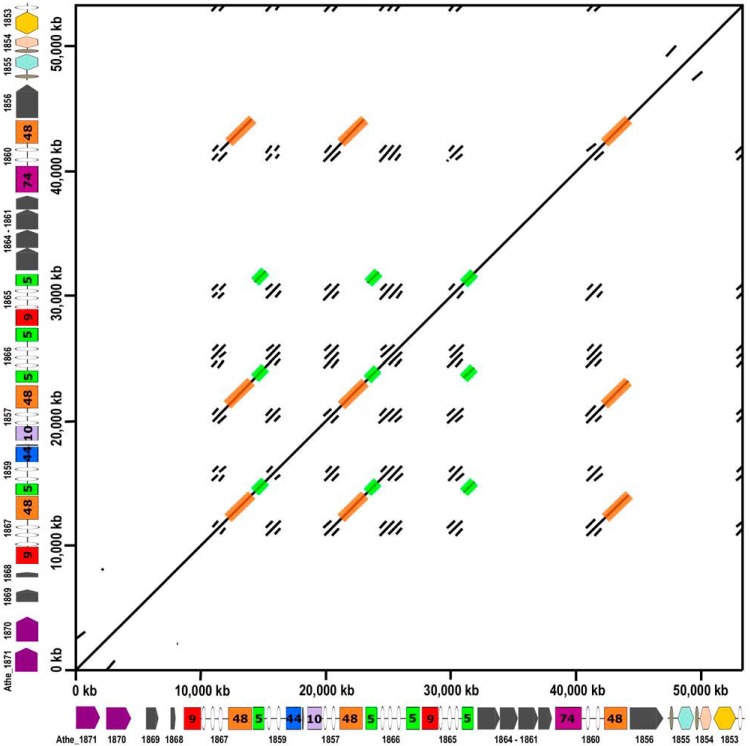
FIG 3.
Dot plot showing the repeated DNA sequence of the C. bescii GDL. The sequence of the C. bescii GDL was used to construct a dot plot by using EMBOSS dottup (http://www.bioinformatics.nl/cgi-bin/emboss/dottup). A sequence word length of 50 bp was used to construct the plot. Sequences of 50 bp at positions on the x axis that match 50-bp sequences at positions on the y axis result in black pixels. The diagonal line from bottom left to top right show the direct match of the sequence to itself. All other markings represent repeated DNA sequences. The repeated GH48 domains of the GDL are shaded in orange. The repeated GH5 domains of the GDL are shaded in green.

