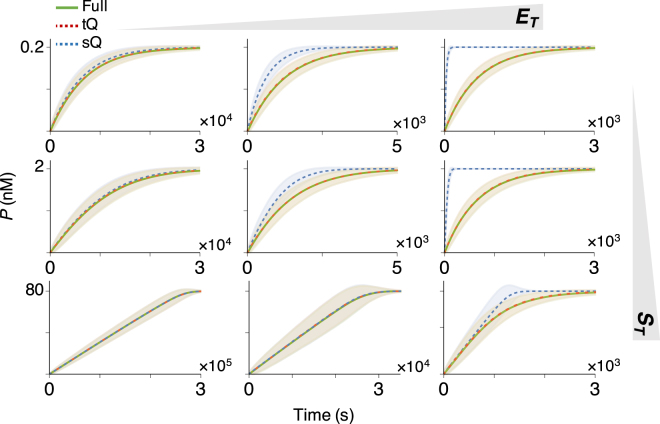
Figure 1.
Whereas the sQ model fails to approximate the original full model as E T increases, the tQ model is accurate regardless of E T. Stochastic simulations of the original full model (Table S1), the sQ model (Table S2), and the tQ model (Table S3) were performed with S T = 0.2, 2, or 80 nM, and E T = 0.2, 2, or 40 nM. Note that these concentrations are either lower than, similar to, or higher than K M ≈ 2 nM. Here, the lines and colored ranges represent a mean trajectory and fluctuation range (±2σ from the mean) of 104 stochastic simulations.

