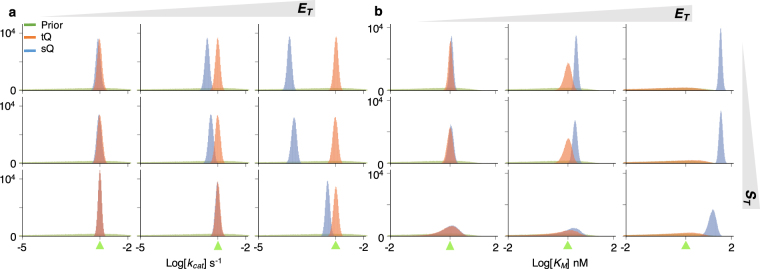
Figure 2.
The estimation of a single parameter (k cat or K M) with either the sQ or the tQ model. For each condition (S T = 0.2, 2, or 80 nM, and E T = 0.2, 2, or 40 nM), 105 posterior samples of either k cat (a) or K M (b) were obtained by applying the Bayesian inference to 102 noisy data sets (Fig. S1) (see Methods for details). When the k cat is sampled, the K M is fixed at its true value (a) and vice versa (b). Here, green triangles indicate the true values of the parameters. Whereas the estimates of k cat and K M obtained with the sQ model are biased as E T increases, those obtained with the tQ model have negligible bias regardless of conditions (See Fig. S3 for box plots of estimates). As E T or S T increases, the posterior variance of K M increases when the tQ model is used.

