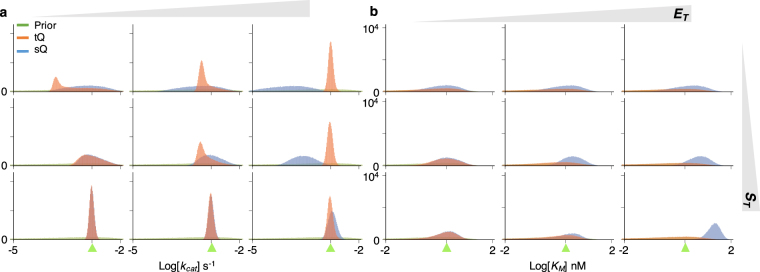
Figure 3.
Simultaneous estimation of two parameters (k cat and K M) with either the sQ or the tQ model. From the same 102 data sets (Fig. S1) used in the single-parameter estimation (Fig. 2), 105 posterior samples of the k cat (a) and the K M (b) were obtained together. Although the same prior is given, the posterior distributions become wider than the single-parameter estimation (Fig. 2). Here, green triangles indicate the true values of k cat or K M.

