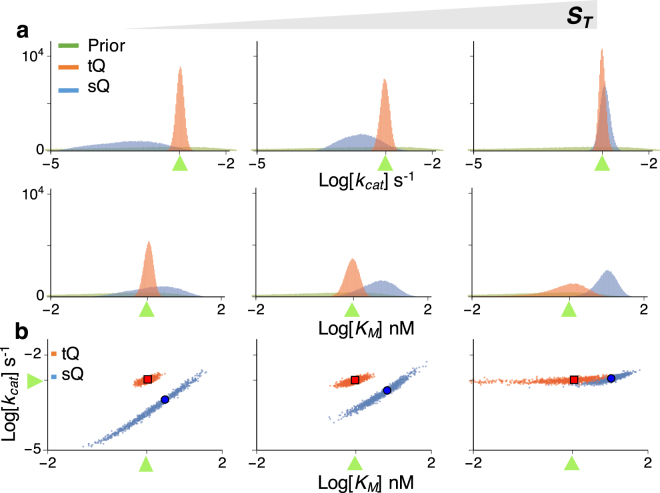
Figure 5.
When data obtained under low E T and high E T are used together, the accuracy and precision of estimaties obtained with the tQ model, but not with the sQ model, are enhanced. (a) Posterior samples are inferred using data sets from E T = 0.2 nM (Fig. S1 top) and E T = 40 nM (Fig. S1 bottom) together for either S T = 0.2, 2, or 80 nM. The posterior variance of the tQ model dramatically decreases to the level of the single-parameter estimation (Fig. 2). However, the estimates of the sQ model show considerable bias. Here, green triangles represent the true values of k cat or K M. (b) The scatter plots of the posterior samples. Here green triangles, blue circles, and red squares represent true values, posterior means of the sQ model, and those of the tQ model, respectively.

