Figure 7.
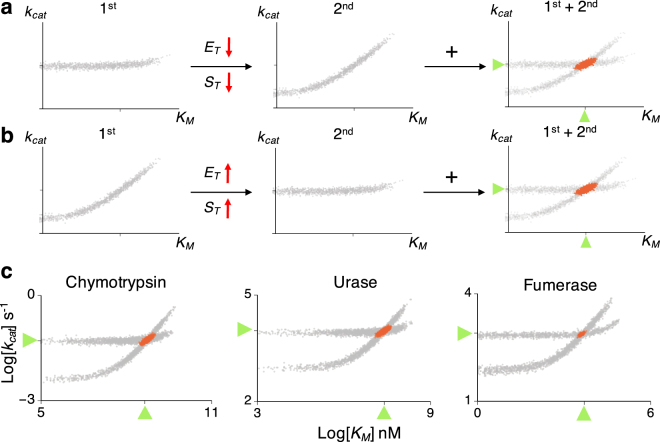
The optimal experimental design for accurate and precise estimation with the tQ model. (a) When the scatter plot of posterior samples from the first experiment is horizontal, E T and S T need to be decreased to obtain the nonhorizontal scatter plot in the next experiment. Then, using the combination of the two experiments leads to accurate and precise estimation (red scatter plots). (b) When the scatter plot from the first experiment is nonhorizontal, E T or S T need to be increased in the next experiment to obtain a horizontal scatter plot. (c) Inference with a single progress curve from the low E T (0.1 K M) and the high E T (10 K M) leads to nonhorizontal and horizontal scatter plots, respectively, for chymotrypsin, urease, and fumarase (gray scatter plots). When both data sets were used together, accurate estimates were obtained for all enzymes (red scatter plots). Here, low S T (0.1 K M) is used. Here, green triangles represent the true values of the parameters.

