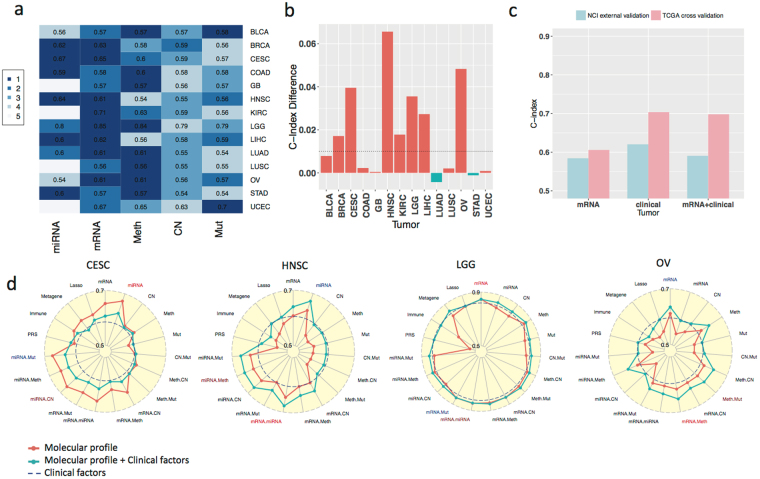
Figure 4.
Prognostic performance of omic platforms across cancer types. (a) C-indices of individual omic platform for each cancer type (row). A C-index of 0.5 indicates random prediction, and values close to 1.0 correspond to the perfect prediction of survival outcome. The colors represent rankings of C-indices for a cancer type (the darker color corresponding the higher rank). (b) The most significant improvement in C-index by combining the omic profile with clinical variables among five omic profiles for each cancer type (e.g., an increase of 0.066 in C-index, representing 10.8% improvement, was observed in HNSC). Positive values indicate additional gains by combining molecular and clinical predictors over using clinical factors alone. (c) Validation of the lung adenocarcinoma mRNA kernel machine learning model developed in the TCGA data and validated in a National Cancer Institute (NCI) study cohort. (d) Radar plots of C-index for individual and combinations of omic platforms in four cancer types. Blue dotted line benchmarks the performance of the clinical variables.

