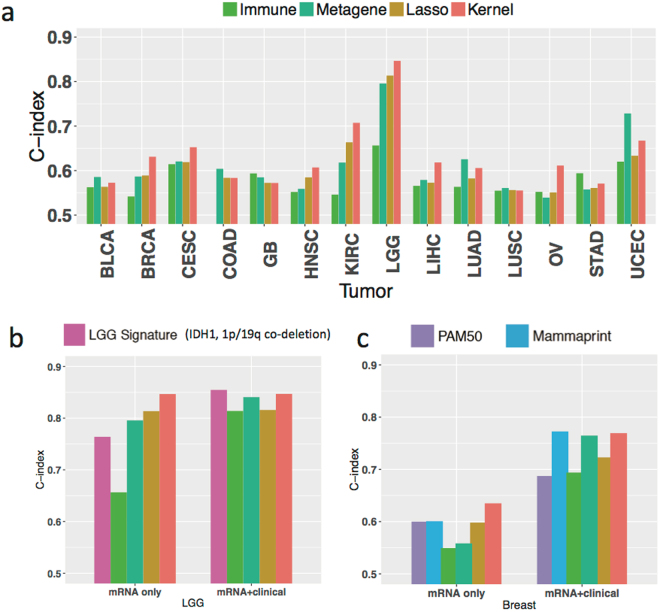
Figure 5.
Comparing kernel prediction with the established prognostic signatures. (a) Bar plots of C-index for the kernel machine learning method, an immune infiltration signature, a Metagene signature (capturing chromosome instability, mesenchymal transition, and lymphocyte immune recruitment), and data-driven selection of mRNA transcripts using Lasso-regression across cancer types. (b) Extended analysis of low grade glioma (LGG) including the IDH1, chromosome 1p/19q co-deletion prognostic subtypes. (c) Extended analysis of BRCA including the PAM50 classification and the MammaPrint signature.

