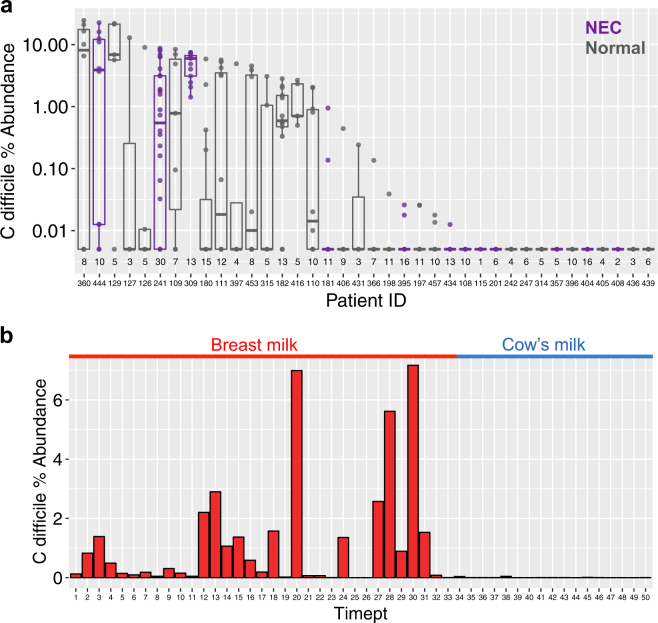
Fig. 2.
Distribution of C. difficile during longitudinal gut microbiome sampling of infants. a Pre-term infants in a NICU, including those developing necrotizing enterocolitis (purple) and normal (grey). Each boxplot reflects a single patient with multiple time points (total samples per patient shown along the x-axis). b A longitudinal case study of an infant before (red) and after (blue) weaning during the first 18 months of life. During the transition to cow’s milk, C. difficile relative abundance fell to undetectable levels

