Figure 1.
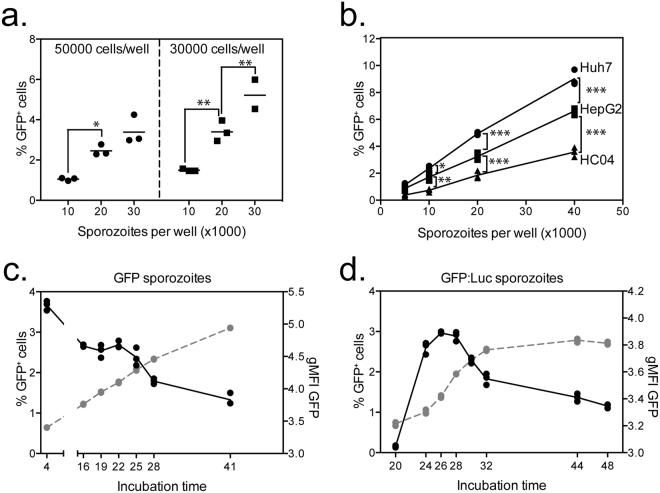
Optimisation of culture conditions for detection of infection P. berghei by flow cytometry. (a) 50000 or 30000 HepG2 cells were plated per well and infected with 10000, 20000 or 30000 PbGFP sporozoites and harvested the following day to measure the percentage of infected cells by flow cytometry. (b) 30000 Huh7, HepG2 or HC04 cells were seeded per well and subsequently infected with increasing numbers of PbGFP sporozoites. Cells were harvested the following day and the percentage of infected cells determined by flow cytometry. (c) 30000 Huh7 cells per well were infected with 15000 PbGFP sporozoites and the percentage of infected cells was measured between 4 and 41 hours after incubation. The graph represents the percentage of GFP+ cells (left axis) (black line) or log Mean Fluorescence Intensity (MFI) of GFP from GFP+ cells (right axis) (grey line) against the time after infection. (d) 30000 Huh7 cells per well were infected with 20000 PbGFP-Luc sporozoites and the percentage of infected cells was measured between 20 and 48 hours after incubation. The graph represents the percentage of infected cells (left axis) (black line) or log Mean Fluorescence Intensity (MFI) of GFP in GFP+ cells (right axis) (grey line) against the time after infection.

