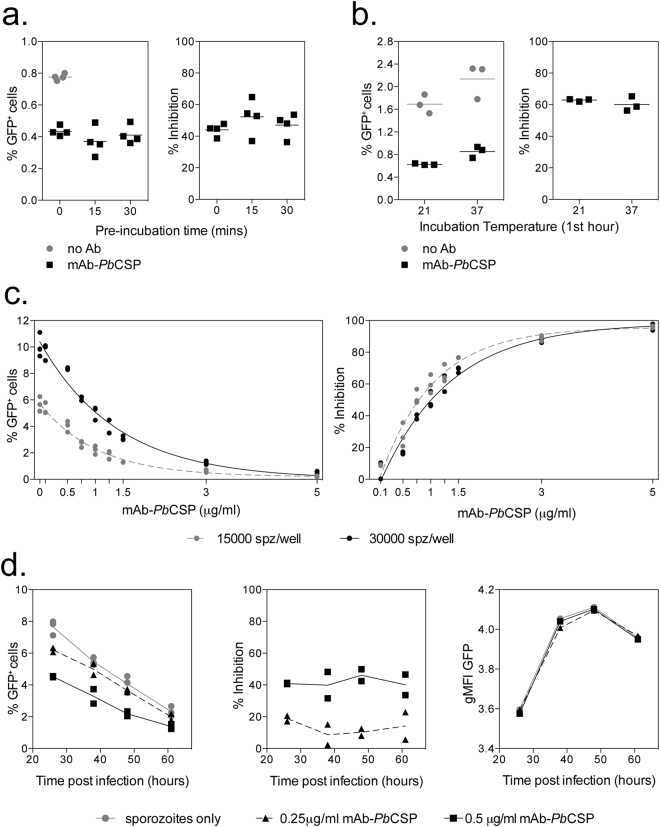
Figure 2.
Optimising the detection of antibody mediated inhibition of sporozoite invasion. (a) 10000 PbGFP sporozoites were incubated with 1 μg/mL mAb-PbCSP (3D11) on ice for 0, 15 or 30 minutes prior to addition to 30000 Huh7 cells. Cells were harvested the following day and the percentage of GFP+ cells determined by flow cytometry. The graphs represent the percentage of GFP+ cells (left) or percentage of inhibition (right) when compared to the sporozoite only control well. (b) 20000 PbGFP sporozoites together with 1 μg/ml mAb-PbCSP were added to 30000 Huh7 cells and incubated at 21 oC or 37 oC for 1 hour, prior to overnight incubation at 37 oC. Cells were harvested the following day and the percentage of GFP+ cells determined by flow cytometry. Graphs represent the percentage of GFP+ cells (left) or percentage of inhibition (right) when mAb-PbCSP wells were compared to sporozoite only wells incubated under the same conditions. (c) 30000 (black) or 15000 (grey) sporozoites (PbGFP-Luc) were added to 30000 Huh7 cells in the presence of a range of mAb-PbCSP concentrations (0–5 μg/mL) and percentage of infection measured by flow cytometry the following day. Graphs represent the percentage of GFP+ (left) or percentage of inhibition (right) when addition of mAb-PbCSP was compared to sporozoite only control wells. Data was analysed with a two-way ANOVA which showed a significant effect of antibody concentration but no significant effect of sporozoite number. (d) 15000 sporozoites (PbGFP-Luc) were added to 30000 Huh7 cells per well in the presence of mAb-PbCSP (0.25 or 0.5 μg/mL) and harvested at different times after infection. Graphs represent the percentage of GFP+ cells over time (left), percentage of inhibition (middle) or log GFP MFI of infected cells over time (right). The percentage of inhibition data was analysed with a two-way ANOVA to test for the effect of antibody concentration over time, no significant effect of time was observed. Log (MFI GFP+) data was analysed with a two-way ANOVA and post-hoc Dunn’s multiple comparisons test, but no difference between groups at each timepoint was observed.

