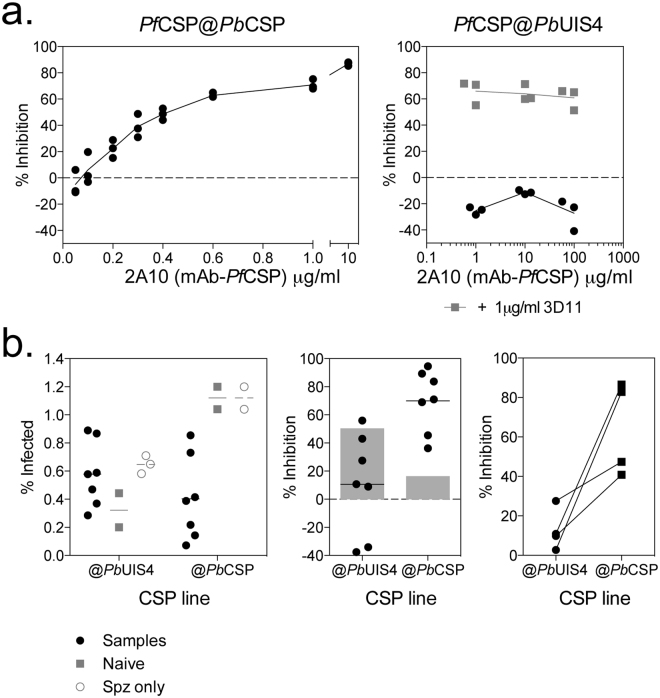
Figure 3.
Inhibition of PfCSP@PbCSP and PfCSP@PbUIS4 parasites with monoclonal antibodies. (a) 15000 sporozoites PfCSP replacement (PfCSP@PbCSP) (left) or PfCSP addition (PfCSP@PbUIS4) (right) were added to 30000 Huh7 cells with increasing concentrations of mAb-PfCSP (2A10), with the addition of mAb-PbCSP (3D11) at 1 μg/mL for PfCSP addition parasites (grey squares). Cells were harvested 24 to 28 hours later and the percentage of infected cells determined by flow cytometry. Graphs represent the percentage of inhibition relative to sporozoite only control wells, calculated for each replicate at each dose. (b) 20000 Huh7 cells per well were cultured overnight prior to the addition of either 10000 PfCSP@PbCSP or PfCSP@PbUIS4 sporozoites together with serum samples from ChAd63-MVA vaccinated mice (5% final concentration of serum) (in a separate experiment from Fig. 4). Cells were harvested 24 to 28 hours later and the percentage of infected cells determined by flow cytometry. Graphs represent the frequency of GFP + cells (left), percentage of inhibition (middle) against each parasite strain or when comparing the same serum sample tested with either cell line (right). Grey bars denote the percentage of inhibition observed in the assay with naïve serum samples.

