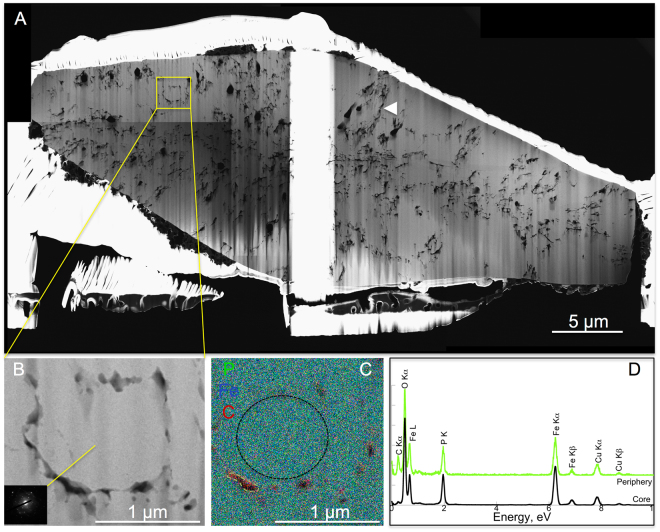
Figure 7.
TEM analysis of a FIB section through a bipyramidal mineral from S. acidocaldarius mineralized for 24 h and heated for 1 day at 150 °C in close system. STEM (A) and TEM (B) images of the section and corresponding SAED pattern consistent with lipscombite. (C,D) EDX map and spectra of the area in (B). Colours of the spectra correspond to regions of interest of the same colour in (C). Arrowhead in panel A shows a large ovoid possibly resulting from the coalescence of individual cellular residues.

