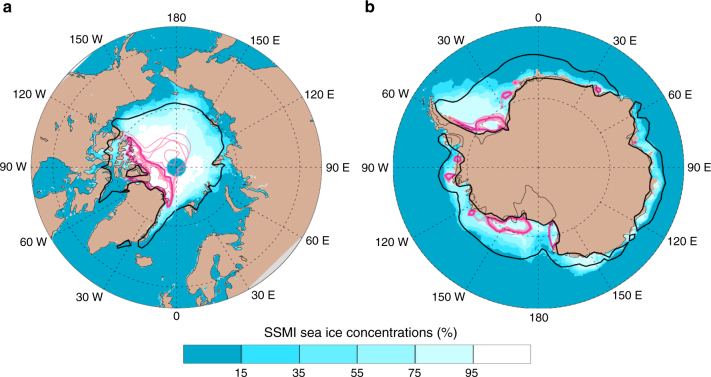
Fig. 1.
Impact of sea-ice physics parameter perturbations on Arctic and Antarctic sea-ice cover. a Arctic sea-ice concentrations, September. b Antarctic sea-ice concentrations, March. Shown are monthly mean sea-ice concentrations. Areas contained within contour lines have sea-ice fractions larger than 15%. Thick black lines denote control ensemble means, thick purple lines show “low Arctic ice” in a and “low Antarctic ice” ensemble means in b. Thin purple lines indicate individual “low Arctic ice” (“low Antarctic ice”) simulations. The colored shading indicates the average observed September (a) and March (b) sea-ice concentrations over the period 1992–2001 (from the Center for Satellite Exploitation and Research; http://nsidc.org/data/sipn/data-sets.html#seaice-conc-ext). A brief comparison of Arctic vs. Antarctic sea-ice changes is provided in Supplementary Note 1

