Figure 10.
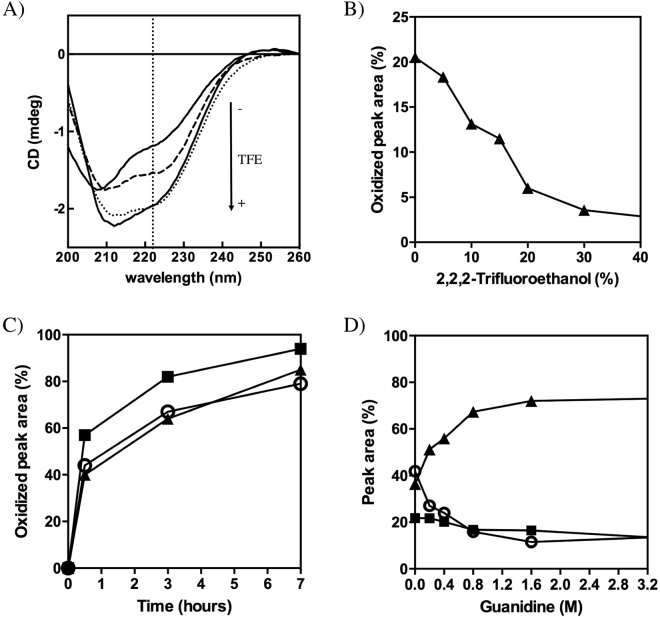
Influence of secondary structure in the oxidative folding of hCox17. (A) Far-UV CD spectra of reduced hCox17 in the absence (upper solid line) and in the presence of 10% (dashed line), 20% (dotted line) and 40% (lower solid line) of TFE. The characteristic α-helix 222 nm signal is indicated as a vertical dotted line. (B) Reduced hCox17 was allowed to refold in the presence of increasing concentrations of TFE. After 1 h of reaction, the samples were acid-quenched and analyzed by RP-HPLC. The native peak area was integrated and plotted as a function of TFE concentration. (C) Reduced hCox17 mutant H1 (circles), H2 (squares) and wild type (solid triangles) proteins were allowed to refold and the normalized native RP-HPLC peak areas are plotted as a function of the refolding time. (D) hCox17 refolding in the presence of increasing concentrations of Guanidine-HCl was quenched with TFA after 2 hours of reaction. The amount of native (solid triangles), intermediate (solid squares) and reduced (open circles) species are plotted as a function of denaturant concentration.

