Figure 1.
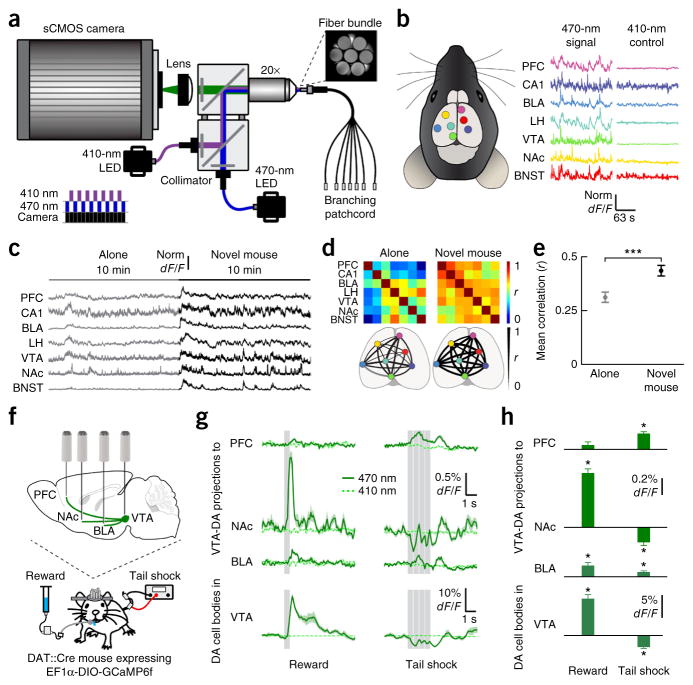
Simultaneous Ca2+ measurements from multiple deep brain regions. (a) Schematic of the microscope used for simultaneous FIP Ca2+ recordings. The diagram at the lower left shows the time-division multiplexing scheme for simultaneous imaging of GCaMP6 at 470 nm and 410 nm. (b) Left, schematic of fiber placements in seven different brain regions expressing GCaMP6f. Right, example Ca2+ traces and simultaneously recorded control traces from a freely moving mouse. (c) GCaMP6f fluorescence traces simultaneously acquired across seven brain regions of a mouse when it was alone or socializing with a novel mouse. (d) Top, heat maps of Pearson’s correlation coefficient (r) calculated between brain regions for the mouse represented in c. Bottom, spatial representations of r between different brain regions. (e) The mean r value between all brain regions in mice alone (0.31 ± 0.024) and in mice socializing with a novel mouse (0.43 ± 0.024). Data plotted as mean ± s.e.m. ***P < 0.001, Wilcoxon’s rank-sum test; n = 84 pairs, 4 mice. (f) Schematic of surgery and recording setup for VTA-DA projection imaging. (g) GCaMP6f fluorescence traces simultaneously acquired in each brain region of a mouse in response to reward and tail shock. Data plotted as mean (dark green curves) ± s.e.m. (light green shaded regions). Gray bars indicate time of reward or shock. (h) Responses to reward and shock in each brain region (dF/Fstimulus − dF/Fbaseline) for the mouse represented in g. Data plotted as mean and s.e.m. *P < 0.05, Wilcoxon’s signed-rank test; n = 6 trials, 1 mouse. LH, lateral hypothalamus; BNST, bed nucleus of stria terminalis; Norm, normalized.

