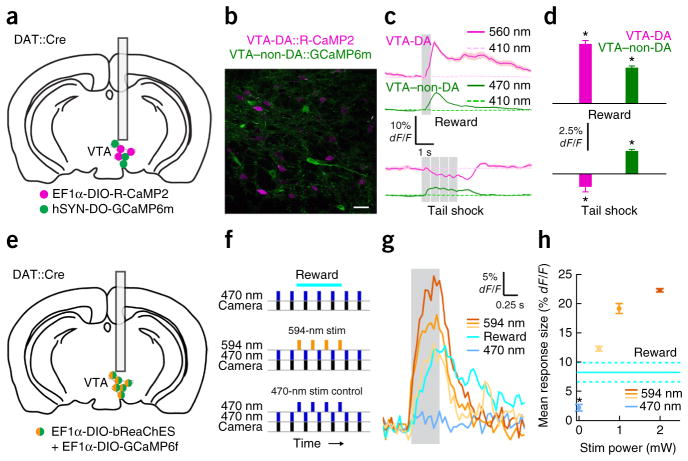
Figure 2.
Dual-color imaging of different populations and simultaneous recording and perturbation of neural activity. (a) Schematic of dual-color imaging surgery. (b) Histology confirming non-overlapping labeled populations of VTA-DA and VTA–non-DA neurons. Scale bar, 25 μm. (c) VTA-DA and VTA–non-DA fluorescence traces acquired after reward or tail shock. Data plotted as mean (curves) ± s.e.m. (shading around curves). Gray bars indicate time of reward or shock. (d) Mean responses to reward and shock (dF/Fstimulus − dF/Fbaseline) for the mouse represented in c. Data plotted as mean and s.e.m. VTA-DA activity increased in response to reward (5.39% ± 0.32% dF/F) and decreased in response to shock (−1.18% ± 0.45% dF/F), whereas VTA–non-DA activity increased after both reward (3.26% ± 0.14% dF/F) and shock (2.08% ± 0.14% dF/F). *P < 0.05, Wilcoxon’s signed-rank test; n = 10 trials, 1 mouse. (e) Schematic of combined imaging and optogenetics surgery. (f) Schematic of imaging paradigm. (g) GCaMP6f fluorescence in response to 5 μW of 470-nm stimulation, 594-nm stimulation (different shades of orange from light to dark denote 0.5 mW, 1 mW and 2 mW of power, respectively) or reward. Gray bar indicates time of stimulation. (h) Mean response to bReaChES stimulation and reward (dF/Fstimulus − dF/Fbaseline). Data plotted as mean ± s.e.m. Color-coding matches the key in g. The mean response to 470-nm cross-stimulation (2.27% ± 0.57% dF/F) was significantly smaller than the response to reward (8.27% ± 1.63% dF/F) (*P < 0.05, Wilcoxon’s rank-sum test, n = 6 trials for 470 nm and 4 trials for reward/1 mouse). Dashed lines indicate ±s.e.m. Stim, stimulus.

