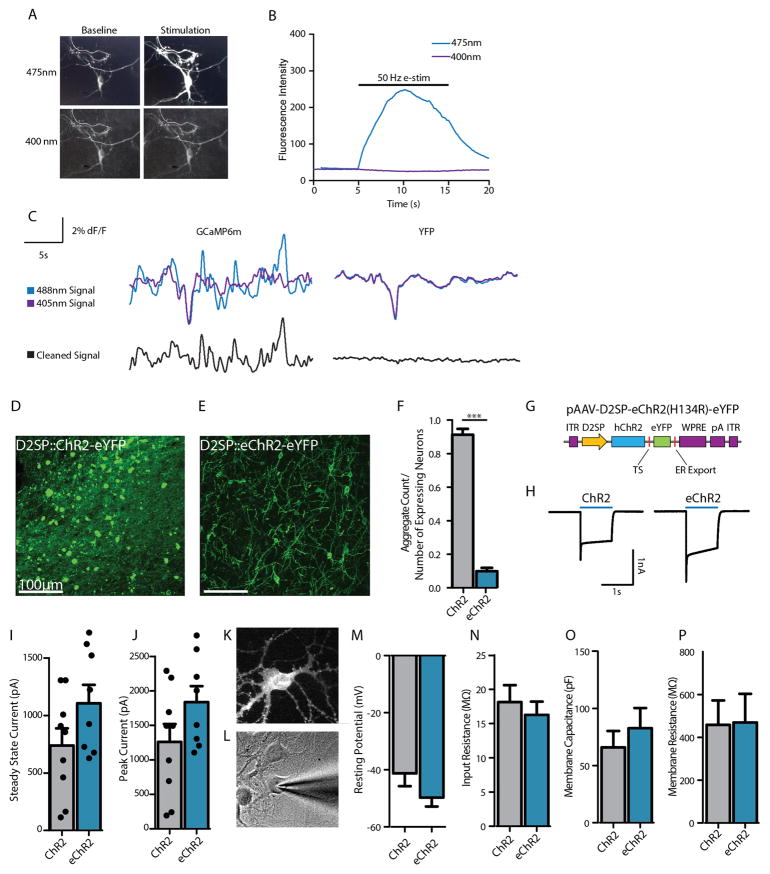
Extended Data Figure 7. Characterization of dual-wavelength photometry and eChR2.
a, Images of a GCaMP6m-expressing neuron illuminated at the imaging wavelength (475 nm) and the isosbestic wavelength (400 nm), at baseline (left) and with 10 s of 50 Hz electrical stimulation (right). b, Fluorescence intensity from a representative neuron, illuminated at 475 nm and 400 nm, during 10 s of 50 Hz electrical stimulation. c, Traces from a GCaMP6m-expressing rat (left) and a YFP-expressing rat (right) during the gambling task. Cyan traces are of the imaging wavelength; violet traces are of the isosbestic wavelength; black traces represent the cleaned signal (Methods). d, Expression of D2SP-ChR2-eYFP in rat NAc, showing evidence of opsin accumulations (bright green spots). e, Expression of D2SP-eChR2-eYFP in rat NAc; note greatly reduced accumulation density. f, D2SP-ChR2-eYFP-expressing cells have significantly more aggregates than D2SP-eChR2-eYFP-expressing cells. Quantification is in number of aggregates per expressing cell across ex vivo histological sections (t-test, t7 =21.25, ***P <0.0001; n =168 ChR2-expressing cells in 4 sections, n = 131 eChR2-expressing cells in 5 sections). g, Backbone diagram of pAAV-D2SP-eChR2(H134R)-eYFP showing the membrane trafficking modifications (trafficking signal (TS) and endoplasmic reticulum (ER) export motifs). h, Representative photocurrents evoked by ChR2 and eChR2 in cultured neurons by 1 s 473-nm light. i, Steady-state photocurrents measured from ChR2- and eChR2-expressing cultured neurons. In addition to showing reduced accumulations, photocurrents trended higher with eChR2. j, Peak photocurrents measured from ChR2- and eChR2-expressing cultured neurons; eChR2 trended towards higher peaks as well. k, Expression of eChR2-eYFP in a cultured rat striatal neuron. l, Whole-cell patch-clamp recording from the neuron shown in k. m–p, Resting membrane potential, input resistance, membrane capacitance, and membrane resistance measured from ChR2- and eChR2-expressing cultured neurons; no significant differences were observed. All error bars represent s.e.m.

