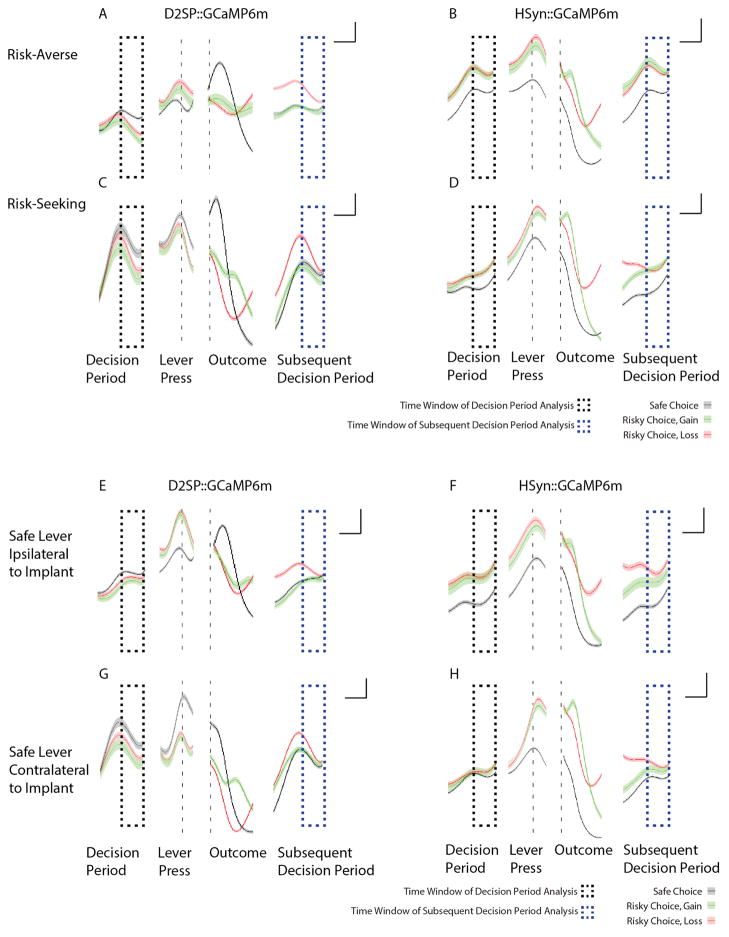
Extended Data Figure 8. D2R+ (but not pan-neuronal) cellular signals are increased during the decision-period leading to risk rejection (safe choice) and encode prior loss.
a–h, In all plots, black dashed boxes indicate decision-period activity, and blue dashed boxes indicate subsequent decision-period activity. Traces indicate mean neural activity sorted on trial outcome: safe (black), gain (green) or loss (red). Shaded regions indicate s.e.m. a, Average traces from the most risk-averse cell-specific D2SP-GCaMP6m-expressing rats (n = 3). Note increased neural activity during the decision period preceding a safe choice as compared to a risky (gain or loss) choice, as well as increased activity during the subsequent decision period (blue dashed box) following a loss outcome. b, Average traces from the most risk-averse non-cell-type-specific (hSYN-GCaMP6m-expressing) rats (n = 4). Note the increased activity in these cells during the decision period before making a risky (red/green) as compared to safe (black) choice (contrasting with the opposite D2R+-specific result in a). Also in contrast to the D2R+ case, the pan-neuronal signal did not discriminate immediately-preceding loss (red) from immediately-preceding gain (green) during the subsequent decision period. c, d, These pattern were also consistent in the most risk-seeking animals (D2SP-GCaMP6m-expressing rats, n =3; hSYN-GCaMP6m-expressing rats, n =4). e–h, This pattern did not depend on the location of the implant relative to the safe lever. Shown are data from D2SP-GCaMP6m-expressing rats with implants ipsilateral to the location of the safe lever (n = 4); hSYN-GCaMP6m-expressing rats with implants ipsilateral to the location of the safe lever (n =4); D2SP-GCaMP6m-expressing rats with implants contralateral to the location of the safe lever (n = 2); hSYN-GCaMP6m-expressing rats with implants contralateral to the location of the safe lever (n = 4). Data for a, c, e and g are from the rats whose behaviour and neural data are represented in Fig. 3. Data for b, d, f and h are not represented in the main figures of the manuscript. Throughout the figure, traces were analysed as dF/F and z-score normalized before averaging. Scale bars indicate 1 s and 0.25 standard (z-score) units.

