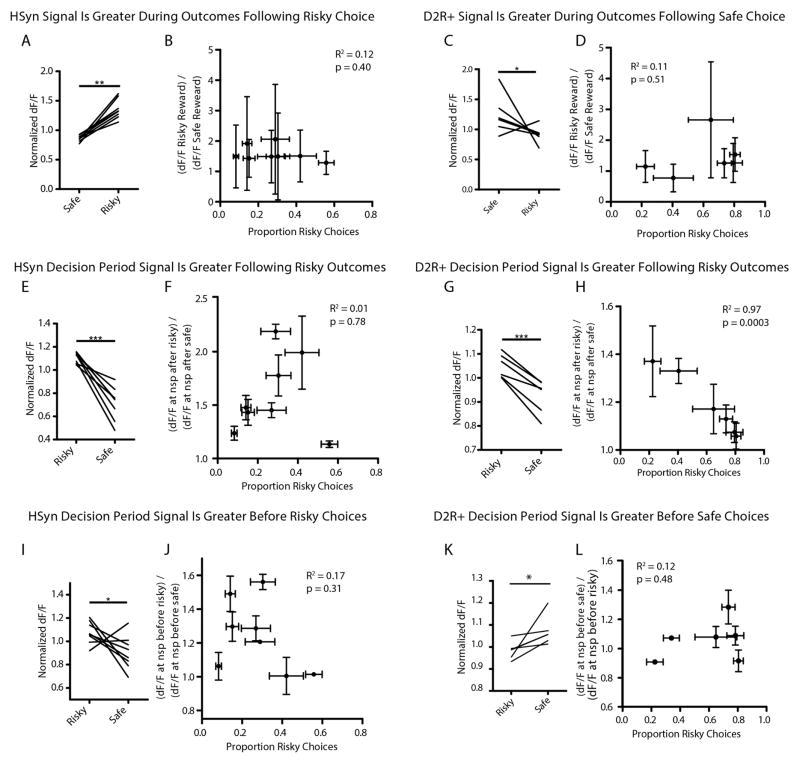
Extended Data Figure 9. Pan-neuronal NAc recordings: increased activity associated with risky decisions.
a, Median-normalized dF/F signal during the first second of the outcome period for each hSYN-GCaMP6m-expressing rat, comparing risky outcomes to safe outcomes (n = 8; Wilcoxon matched-pairs test, W =36, P =0.008). b, Lack of correlation between the proportion of choices made by each rat to the risky lever and the individual’s risky versus safe outcome signal ((dF/F) during the first 1 s of risky outcome/(dF/F) during safe outcome) (n =8 rats, Pearson’s r2 =0.12, P =0.40). c, Median-normalized dF/F signal during the first second of the outcome period for each D2SP-GCaMP6m-expressing rat, comparing safe outcomes to risky outcomes (n =6; Wilcoxon matched-pairs test, W =17, P =0.04). d, Lack of correlation between the proportion of choices made by each rat to the risky lever and the individual’s risky versus safe outcome signal ((dF/F) during the first 1 s of safe outcome/(dF/F) during risky outcome) (n =6; Pearson’s r2 =0.11, P =0.51). e, Median-normalized dF/F signal at the time of trial initiation for each hSYN-GCaMP6m-expressing rat, sorted on previous trial outcome, comparing risky outcomes to safe outcomes (n =8; paired t-test, t7 =7.25, P =0.0002). f, Lack of correlation between the proportion of choices made by each rat to the risky lever and the individual’s risk signal ((dF/F) at nosepoke trial initiation after risky outcome/(dF/F) after safe outcome) (n =8; Pearson’s r2 =0.01, P =0.78). g, Median-normalized dF/F signal at the time of trial initiation for each D2SP-GCaMP6m-expressing rat, sorted on previous trial outcome, comparing risky outcomes to safe outcomes (n =6; paired t-test, t5 =6.901, P =0.001). h, Correlation between the proportion of choices made by each D2SP-GCaMP6m-expressing rat to the risky lever and the individual’s risk signal ((dF/F) at nosepoke trial initiation after risky outcome/(dF/F) after safe outcome) (n =6; Pearson’s r2 =0.97, P =0.0003). i, Median-normalized dF/F signal at the time of trial initiation for each hSYN-GCaMP6m-expressing rat, sorted on upcoming choice, comparing risky choices to safe choices (n =8; paired t-test, t7 =2.11, P =0.036). j, Lack of correlation between the proportion of choices made by each rat to the risky lever and the individual’s decision period signal ((dF/F) at nosepoke trial initiation before a risky choice/(dF/F) before a safe choice) (n =8; Pearson’s r2 =0.17, P =0.31). k, Median-normalized dF/F signal at the time of trial initiation for each D2SP-GCaMP6m-expressing rat, sorted on upcoming choice, comparing risky choices to safe choices (n =8; paired t-test, t7 =2.11, P =0.036). l, Lack of correlation between the proportion of choices made by each rat to the risky lever and the individual’s safe choice signal ((dF/F) at nosepoke trial initiation before choosing safe/(dF/F) at nosepoke before choosing risky) (n =6; Pearson’s r2 =0.12, P =0.48). Data from k and l also appear in Fig. 3i, o and are reproduced here for ease of comparison. All error bars represent s.e.m.

