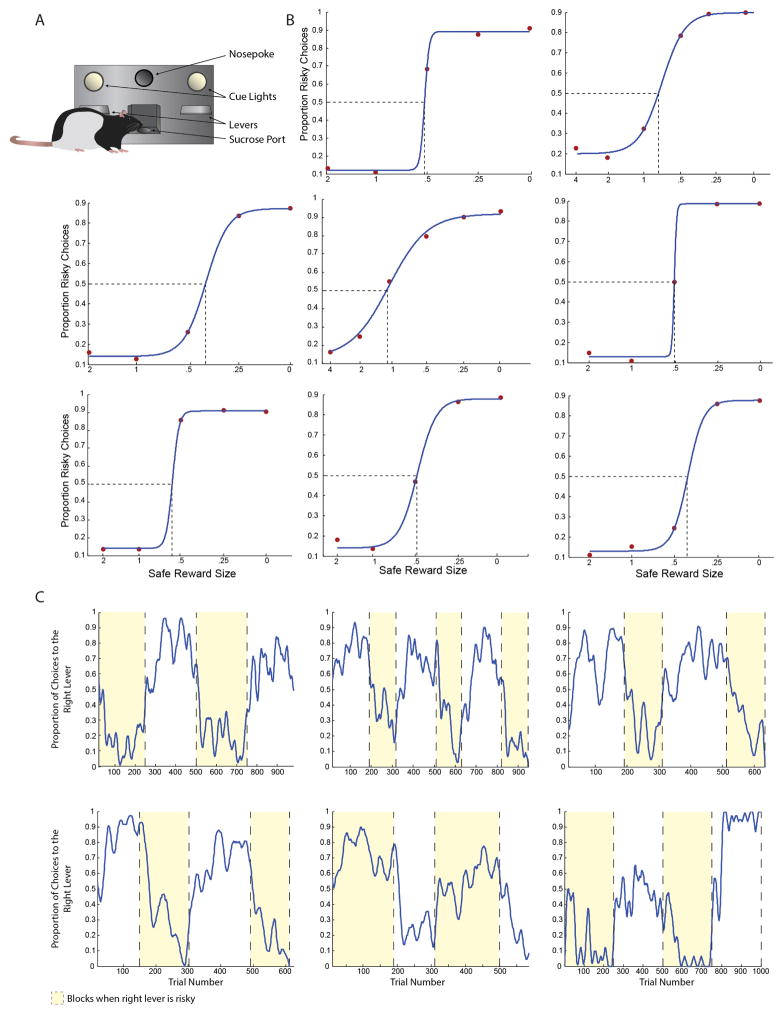
Extended Data Figure 1. Task validation and behavioural controls.
a, Scale diagram of the behavioural apparatus, showing the relative size and location of the nosepoke, levers, and sucrose port. b, Rats varied the proportion of choices they made to the risky lever as a function of the relative value of the safe and risky options. Subplots were constructed for each rat. The size of the safe reward is displayed as a proportion of the expected value of the risky reward. Red points indicate the proportion of risky choices each rat made to the risky lever given a particular value of the safe reward; blue lines indicate sigmoidal fits to those values. Dashed lines indicate each rat’s indifference point. Data in the centre panel are from a risk-seeking rat (indifference point >1); all other rats were risk-averse. Side bias, in these data, would appear as an upward or downward shift of the sigmoid, such that behaviour would asymptote without spanning the range of risky choices, and 50% would not centre the sigmoid on the ordinate. An additional cohort of rats was trained specifically for this control experiment. These rats do not appear elsewhere in the manuscript. c, Rats reversed their behaviour to track their preferred reward contingency (safe or risky). Each panel displays the behaviour of one rat across several hundred trials. The location of the risky lever is alternated in blocks of trials. Blocks where the right lever is risky are highlighted in yellow. Rats’ choices are smoothed with a 15-trial moving window. The rat in the bottom centre panel displayed risk-seeking behaviour; all others were risk-averse. An additional cohort of rats was trained specifically for this control experiment. These rats do not appear elsewhere in the manuscript.

