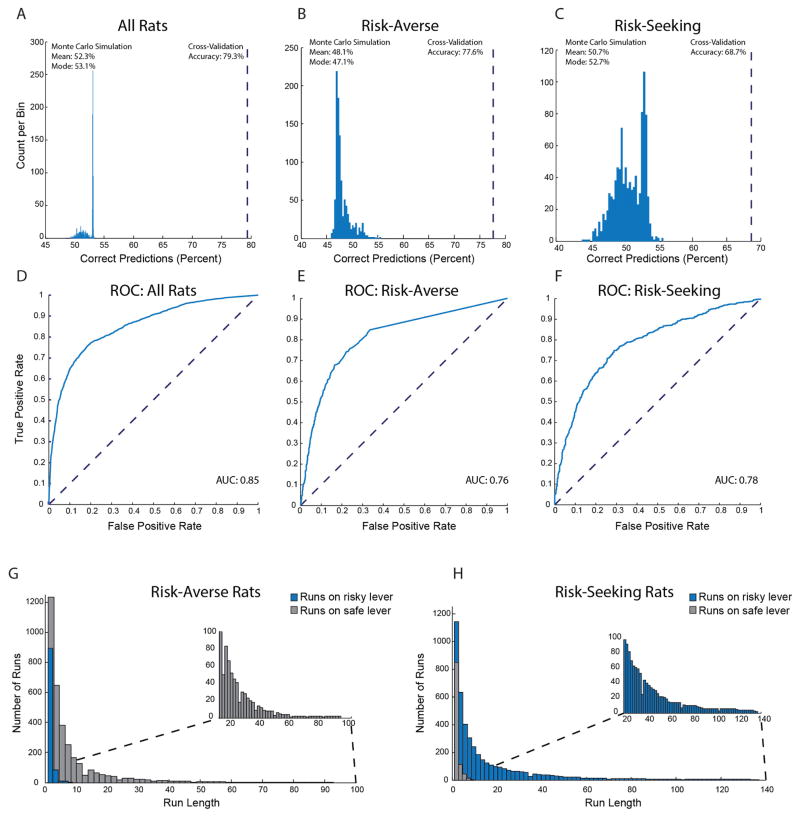
Extended Data Figure 3. Predictive validity of the logistic regression classifier.
a–c, The model was trained on two-thirds of data and tested on the one-third of data that was held-out. The blue histogram indicates the chance distribution, determined by the model’s performance over a 1,000-fold shuffle of the held-out test data. The dashed line indicates cross-validation accuracy (CV) on held-out data. This calculation was performed for data from all rats (a; P < 0.001 by Monte Carlo simulation; CV is 24.3 s.d. outside the chance distribution), a balanced subset of data from risk-averse rats, such that approximately 50% of choices were safe and 50% were risky (b; P < 0.001 by Monte Carlo simulation; CV is 20.6 s.d. outside the chance distribution), and a balanced subset of data from risk-seeking rats (c; P < 0.001 by Monte Carlo simulation; CV is 8.5 s.d. outside the chance distribution). d–f, Receiver operating characteristic (ROC) curves derived from model performance on held-out test data across all rats (d; area under the curve (AUC) = 0.85), a balanced subset of data from risk-averse rats (e; AUC = 0.76), and a balanced subset of data from risk-seeking rats (f; AUC =0.78). g, h, Histogram of run lengths for risk-averse rats (g) and risk-seeking rats (h). Blue bars indicate runs on the risky lever. Grey bars indicate runs on the safe lever. Insets show exceptionally long runs.

