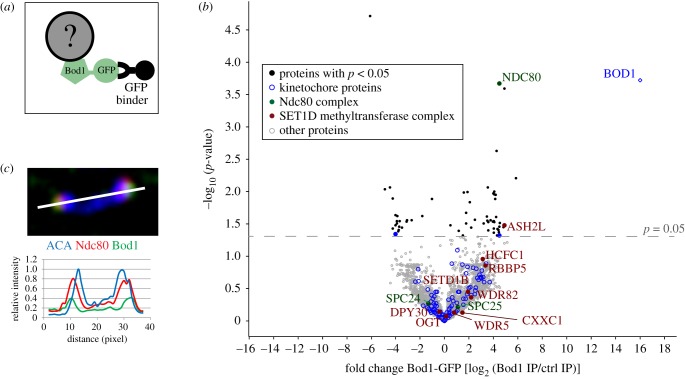
Figure 3.
Proteomics analysis of mitotic Bod1-GFP affinity purifications. (a) GFP binder was used to affinity purify Bod1-GFP and associated proteins from mitotic HeLa cell lysates as described previously [9]. (b) Volcano plot of the mitotic Bod1 interactome detected by label-free quantification shotgun mass spectrometry. For each quantified protein, the –log10 of the p-value obtained in an unpaired Student's t-test with a threshold p-value of 0.05 is plotted against the fold change in Bod1-GFP samples versus control (represented by log2 of their intensity ratios). All kinetochore proteins detected are highlighted in blue. Components of the Ndc80 complex are highlighted in green and labelled. Components of the Set1b complex are highlighted in maroon and labelled. n = 4 biological replicates. (c) HeLa cells were fixed in paraformaldehyde and stained for Ndc80 (red), Bod1 (green) and a marker of the centromeric region (ACA, blue). A pair of kinetochores is shown. White line indicates the region chosen for a line profile (bottom panel) of fluorescence intensities across the kinetochore pair.

